I often get asked what do I need to know to have advanced Excel skills. These days the ability to analyse data in a multitude of ways requires strong Excel skills that are better than asking Google for assistance every step of the way. You need to know formulas, charting, conditional formatting, tables, pivot tables including Power Pivot, excel tools such as goal seek and solver, using short cut keys and finally knowledge and use of Visual Basic for Applications (VBA). This is not a small amount of knowledge to obtain but if you are diligent and practice regularly the skills will come and you will be Excel(ing) like a rock star in no time at all.
Advanced Formula Techniques
Formulas are the building blocks of any Excel spreadsheet. The formulas you use will ultimately determine how flexible your spreadsheet is. The effective use of Excel formulas allows advanced users to summarise large amounts of data, analyse the outputs and make recommendations based on the results.
Must Have Excel Formulas
The following are the must have formulas which will give you genuine analytical skills:
Editing formulas / Error checking
ARRAY formulas
Sound use of formulas and knowing which one to use in any given situation is the foundation block of Advanced Excel knowledge.
Advanced Charting Techniques
Being able to use the right chart in the right situation is key. When you are comparing datasets there are certain charts that work well and charts that do not. Once you understand what message you're trying to tell with the data you have, it's time to select the best method for displaying that information on a page. Different chart types cater best to different methods. To create a comparison chart, use these types of graphs:
Circular Area Chart
Line Chart
Scatter Plot Chart
All of these suggestions will get you started, but remember when you present your data it should be clear, communicative and need no further explanation. If you find that you're restrained by common chart types, then by all means branch out to more experimental techniques. There's no reason not to let your inner designer sit down with your inner statistician—together the two of you can come up with some intelligent and informative methods to present information, and you won't have to fall back on pie charts and bar graphs to do it.
Conditional Formatting
Conditional formatting is an inbuilt Excel feature when used effectively can be visually and operationally extremely powerful. Conditional formatting highlights either areas that exceed, meet or fall short of expectations most notably with a traffic light effect or the use of colour. There are inbuilt icons which make conditional formatting fun and attractive on the page. They are remarkably simple to apply and adjust to add your own criteria. Used intelligently conditional formatting can be a great way to flag issues in business or processes which can prompt a decisive action. The following is a tutorial on Conditional Formatting:
Conditional Formatting Traffic Light
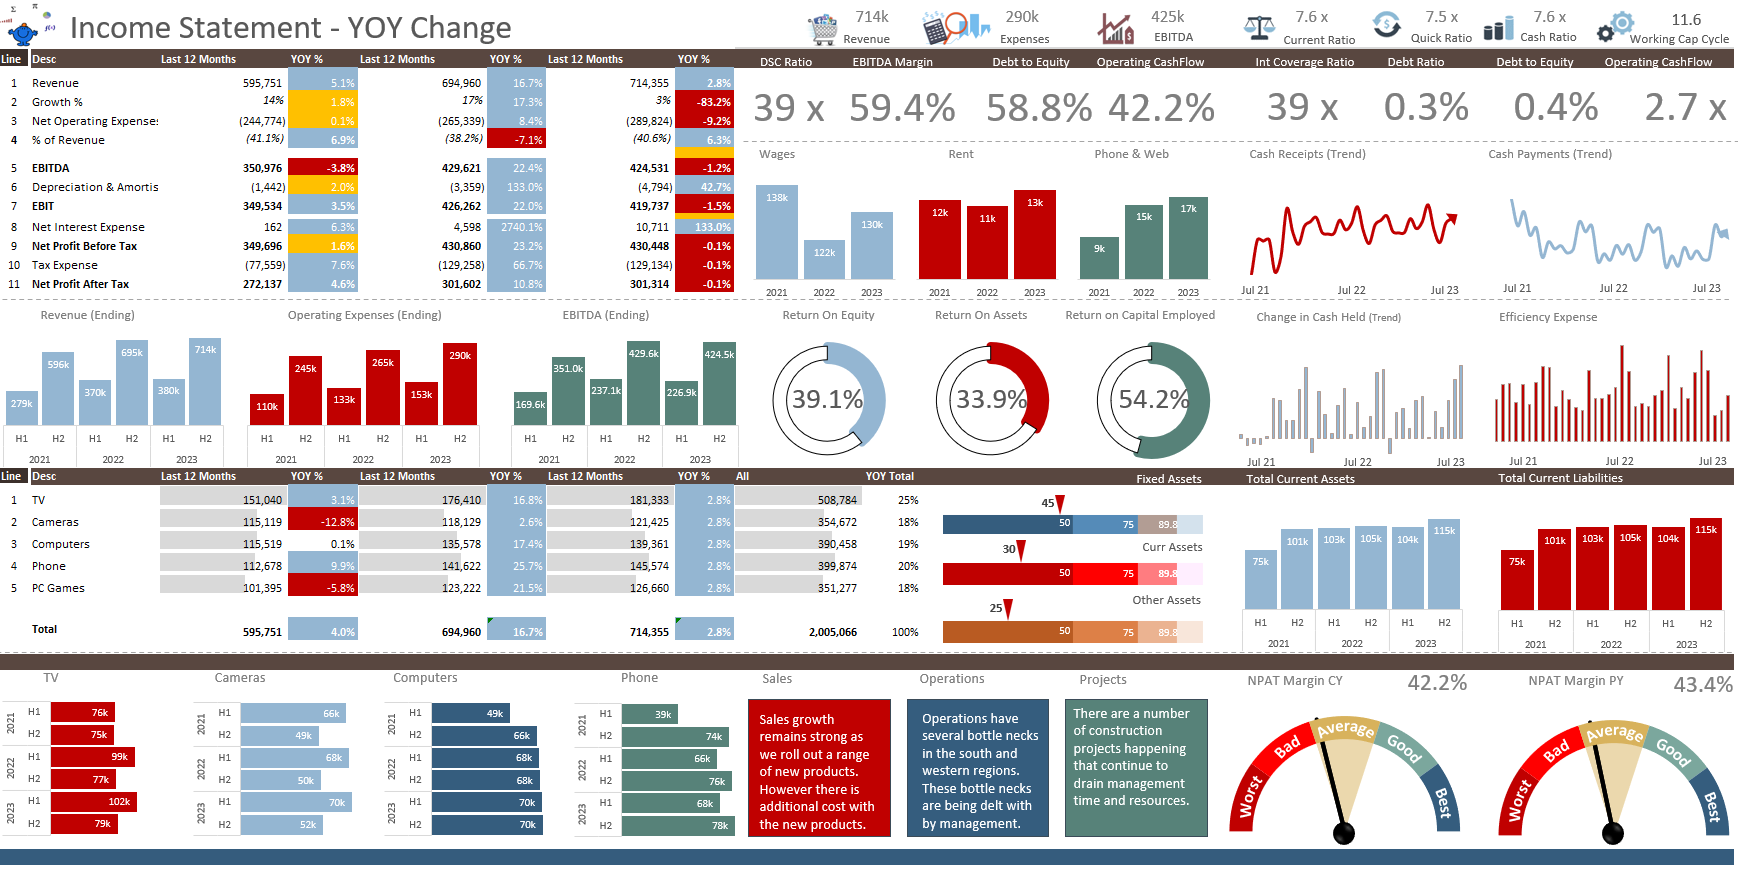
The following is an example of some conditional formatting. The numbers which are coloured use conditional formatting to set the colour - red or green depending on performance.
The above is very easy to apply - if you are interested in how you can apply the up down arrows as shown in the image perhaps look at this tutorial. There is even a YouTube video to help explain the concept with examples.
Tables & Formatting
An Excel table is a way of structuring data in a dynamic way inside of an Excel spreadsheet. Advanced Excel users know how to create and use Excel tables to manipulate and manage their data. In a table the headings will hold the reference to its own column so it is important as per normal to name the column wisely. The following is a structured e
The above is a structured Excel table (created by pressing Ctrl + T).
Tables are an genuinely powerful resource which allows you to generate more data dynamically. The list can grow and any formulas that are associated with a table will grow as well. The formula length will adjust as the table either increases or decreases in size. Tables are a wonderful addition to Excel and well worth adding to your arsenal.
Pivot Tables and Power Pivot
Pivot Tables
A pivot table an inbuilt Excel program that allows you to seamlessly summarise selected datasets to obtain a neat report in a matter of moments. A pivot table looks at the dataset you desire and summarises information based on the column heading. Advanced pivot table functions include one of my favourite things in Excel – the use of slicers to summarise data, other key features include grouping, using different features such as summing, counting, average, min, max.
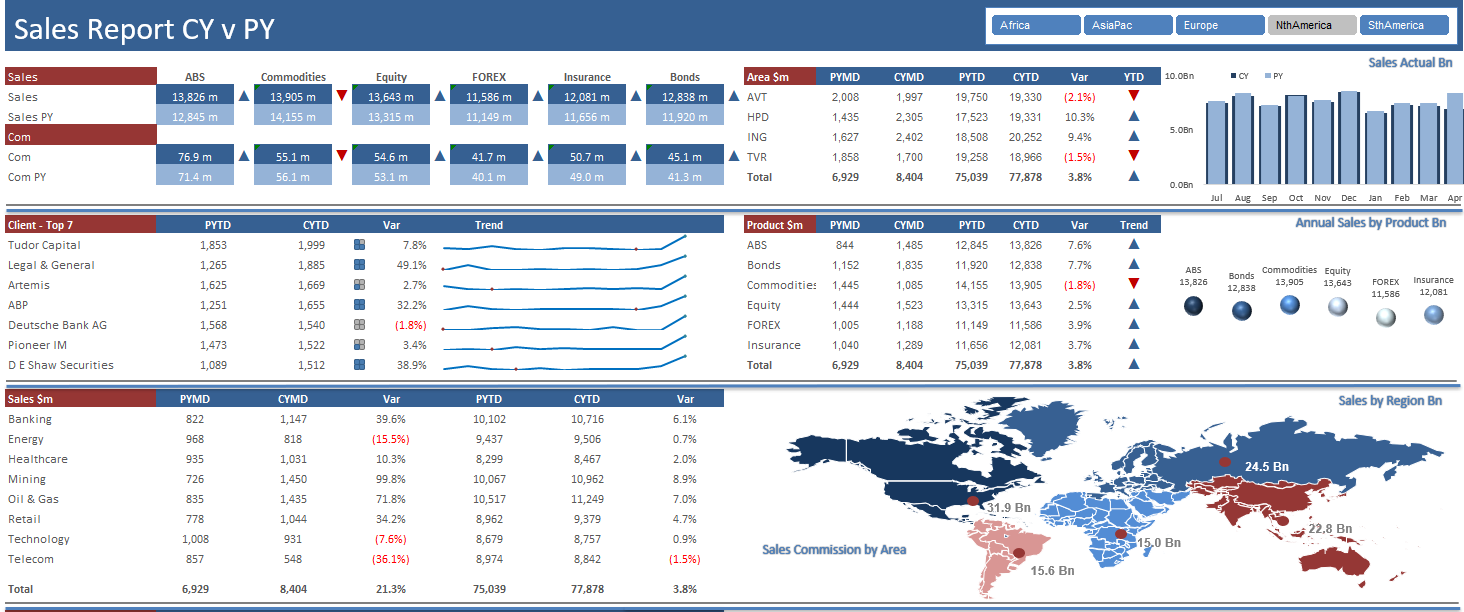
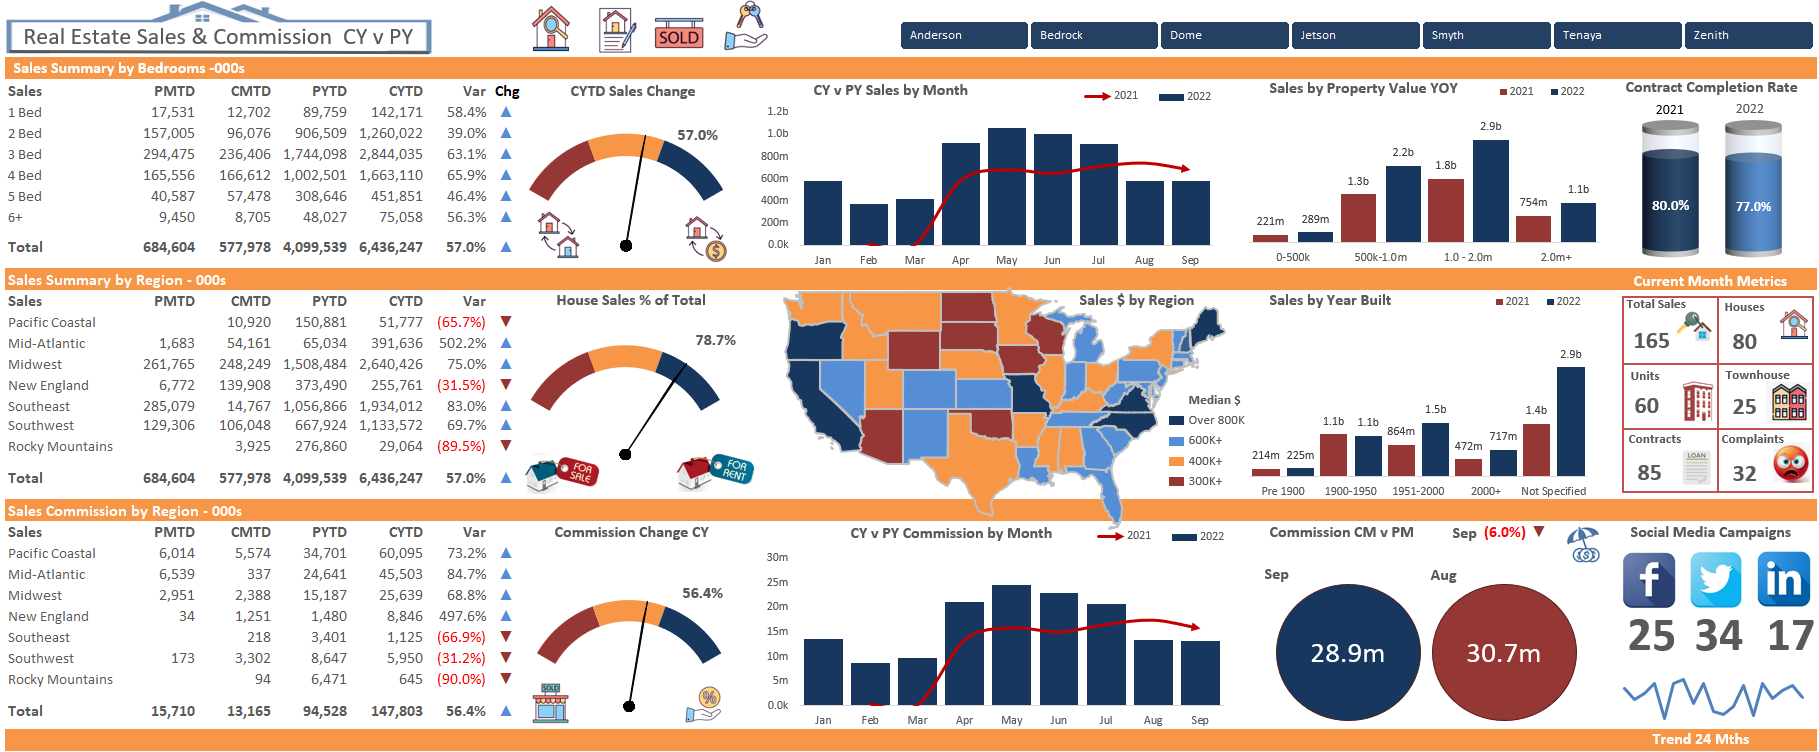
The above report is created entirely from pivot tables. All of the data comes from a single source and falls into the above report nicely. The output uses some relevant charts, a slicer and some conditional formatting to help convey a professional message with Excel.
Power Pivot
Power Pivot is the big brother of the pivot table. With Power Pivot you can store an enormous amount of data from multiple sources (not just a spreadsheet) into Excel back end and summarise multiple tables into a single pivot table. It is this advanced functionally which gives power users a genuine advantage.
Short Cut Keys
I can not recommend highly enough learning Excel’s shortcuts. As an Excel user you can increase your productivity and achieve much more by using the keyboard as opposed to the mouse. If I were to select say 20,000 rows by 20 columns the task would take 10-15 seconds with the mouse – if however I selected Control + Shift + 8 (top keyboard 8 not number pad) then it takes the time to press those 3 keys – a fraction of a second. The data needs to be structured in a tabular format but that is a given for advanced Excel users.
Goal Seek & Solver
Goal Seek
In Excel goal seeking is the ability to calculate a problem by iteratively testing solutions until the correct answer is reached. This is often referred to as what-if analysis or back-solving a problem. The beauty of mastering the technique is you can get optimal solutions to difficult problems in moments without having to run the trial and error yourself. It is worth pointing out that Goal seek works wonderfully well with VBA as usually more than one cell needs a goal and VBA will do many cells in no time at all.
Solver
Excel has a really cool tool called solver that uses trial and error to find optimal solutions for a range of operational problems. It is a sort of WHAT IF analysis and is genuinely useful when determining the optimal outcome, given a set assumptions.
Solver is an Excel Addin which will need to be incorporated into Excel.
Visual Basic for Applications (VBA)
The language that sits behind the Excel spreadsheet is known as Visual Basic for Applications (VBA). With knowledge of VBA and advanced user can make Excel do some amazing things. Tasks can be automated, new formulas can be created and time consuming reporting processes can be done by the computer not the individual. Once the knowledge is acquired the time savings can be enormous.
The Visual Basic for Applications language is not difficult to learn when compared to other languages and users have the advantage of the terms in the language being the same as the Excel front end application. For example a Range in VBA is referred to as a Range, a sheet is a Sheet. So picking up the language is very easy for someone who uses Excel quite a bit.


