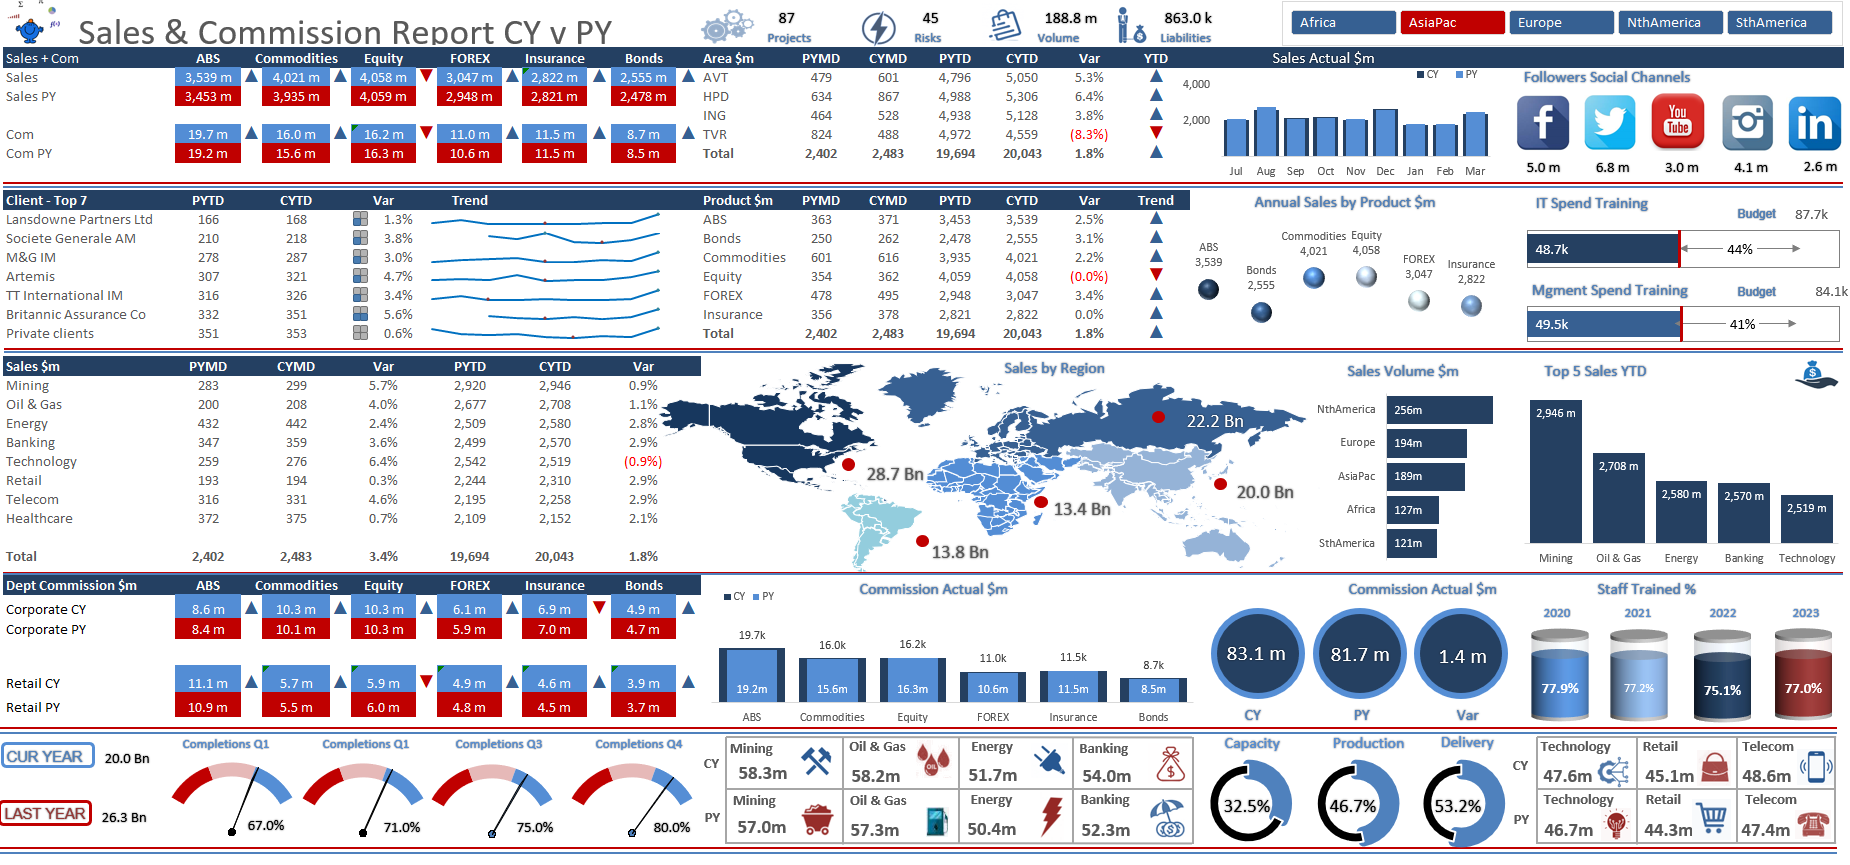
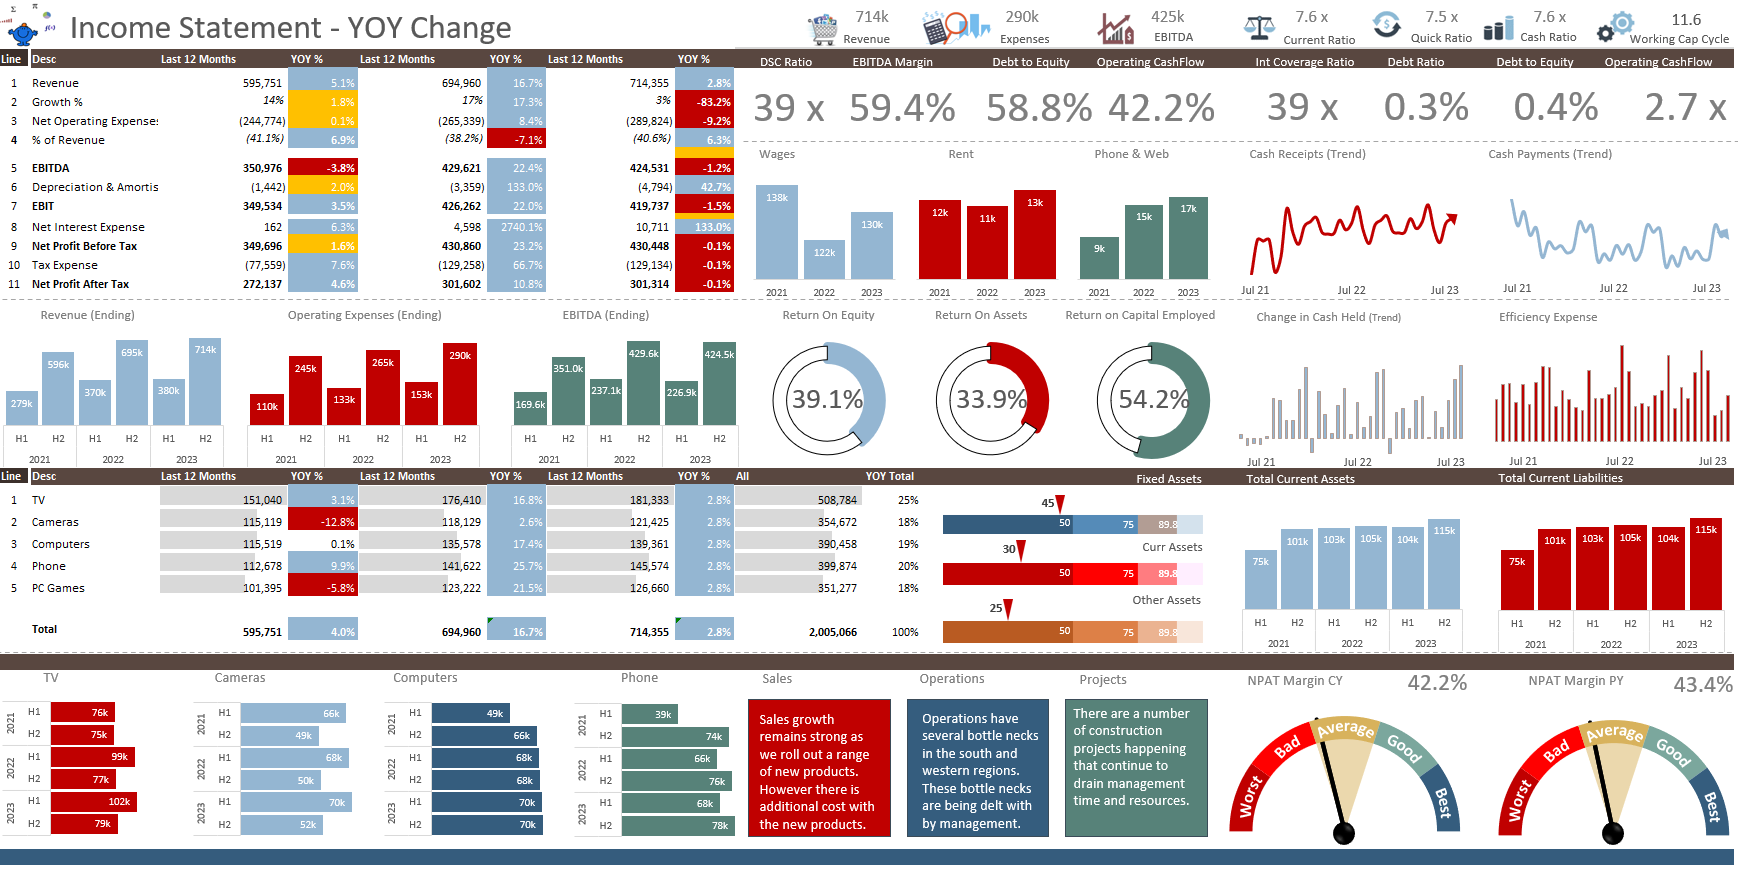
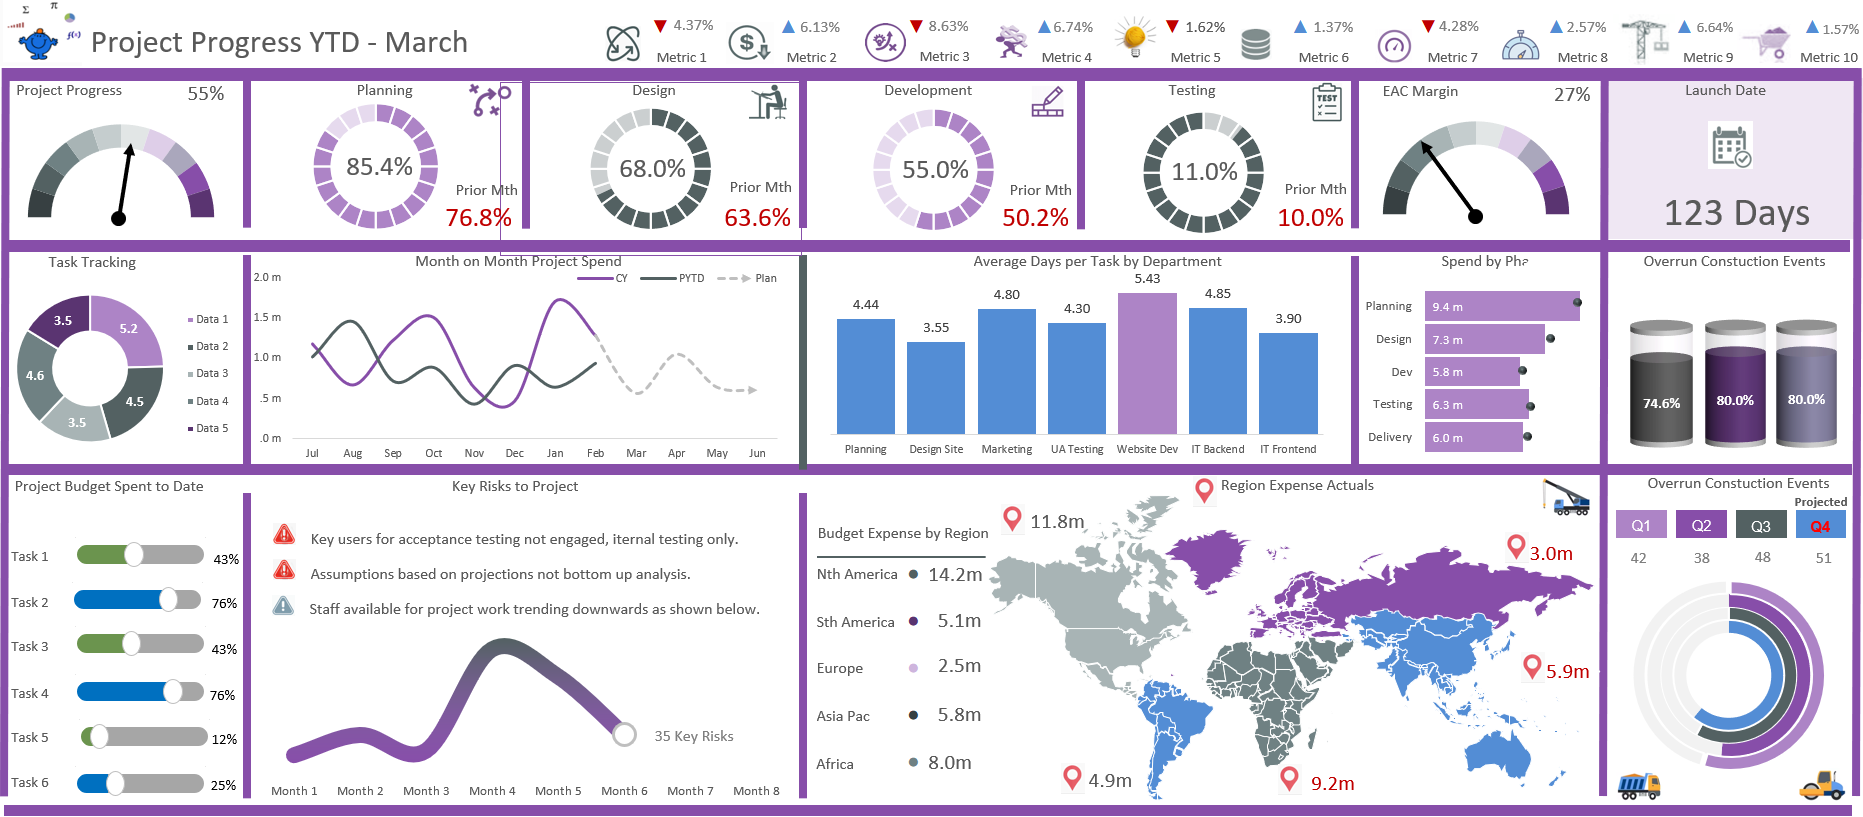
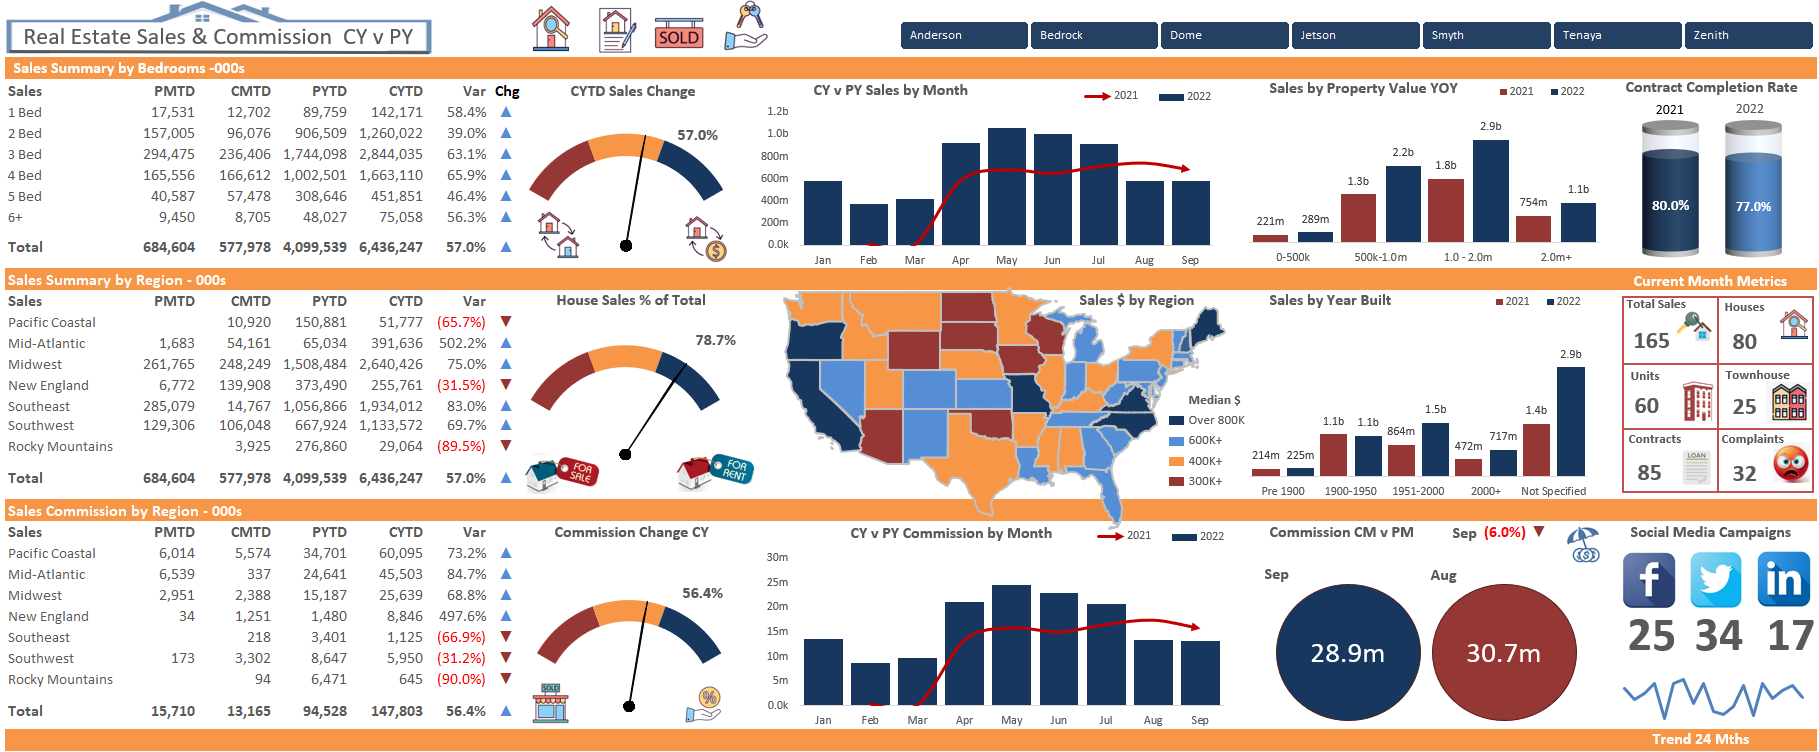
Every now and then I decide my current crop of Excel dashboards needs to be fixed to the point of giving it an overhaul. The following dashboard has been in the stable over 5 years, is designed entirely in Power Pivot and gives a highly flexible dashboard that moves and changes by region. It is a comprehensive financial and operational overview all displayed on a single page.
I am continually updating my crop of dashboards. I have over 100 and some of them are many years old and I get inspired to improve on them. As I add more metrics with new data the size of the file grows too, but a well designed Excel model should not see much change in function.
The above dashboard is the baseline for my Power Pivot course which I run for accounting bodies and clients. I have ran this course several times over the years. It has evolved and grown over time and is one of my favourite creations. It is available in one of my face to face courses. These courses are online as well and can be accessed in the courses section of the website in the header.


