An Excel Bar Chart
A bar chart is simple a Column Chart on its side. It is a visual representation of data which is one of the most common charts when it comes to reporting. This article will take you through the steps to create a bar chart.
To Create a Bar Chart
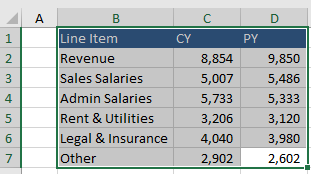
Highlight the area which you wish included in the chart.
in the above example I highlight B1 to D6.
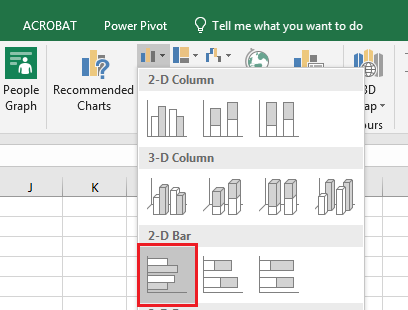
Choose Insert on the menu.
Choose the Column or Bar chart menu and choose a simple 2 D bar chart.
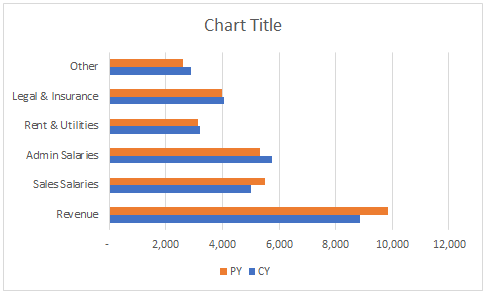
The bar chart is instantly produced.
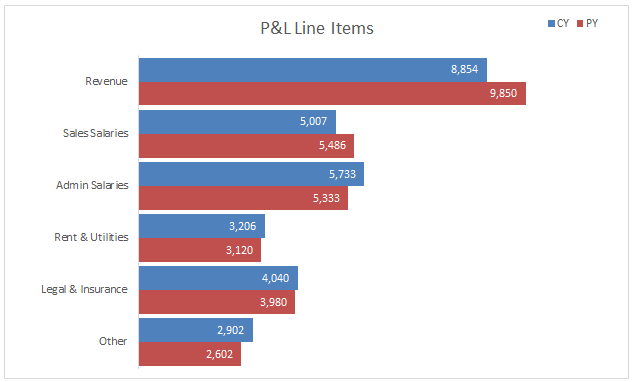
With the smallest amount of work the chart can be transformed to something a bit more imaginative.
The following Excel file contains the bar chart from the above.


