

Inflation Over Multiple Years in a Single Cell
A financial model often estimates the financial results for a single company within the broader economy, focussing on microeconomic difficulties. This article outlines how to add inflation over multiple periods in a single cell.
Read More
Monthly Dashboard With Supporting Metrics
A guide to dashboard design. Outlining several crucial phases that are involved in creating an Excel dashboard:
Read More
Split File into Parts and Save to Directory
In this article we will split a file into many different subsets and save each subset to the directory of your choice.
Read More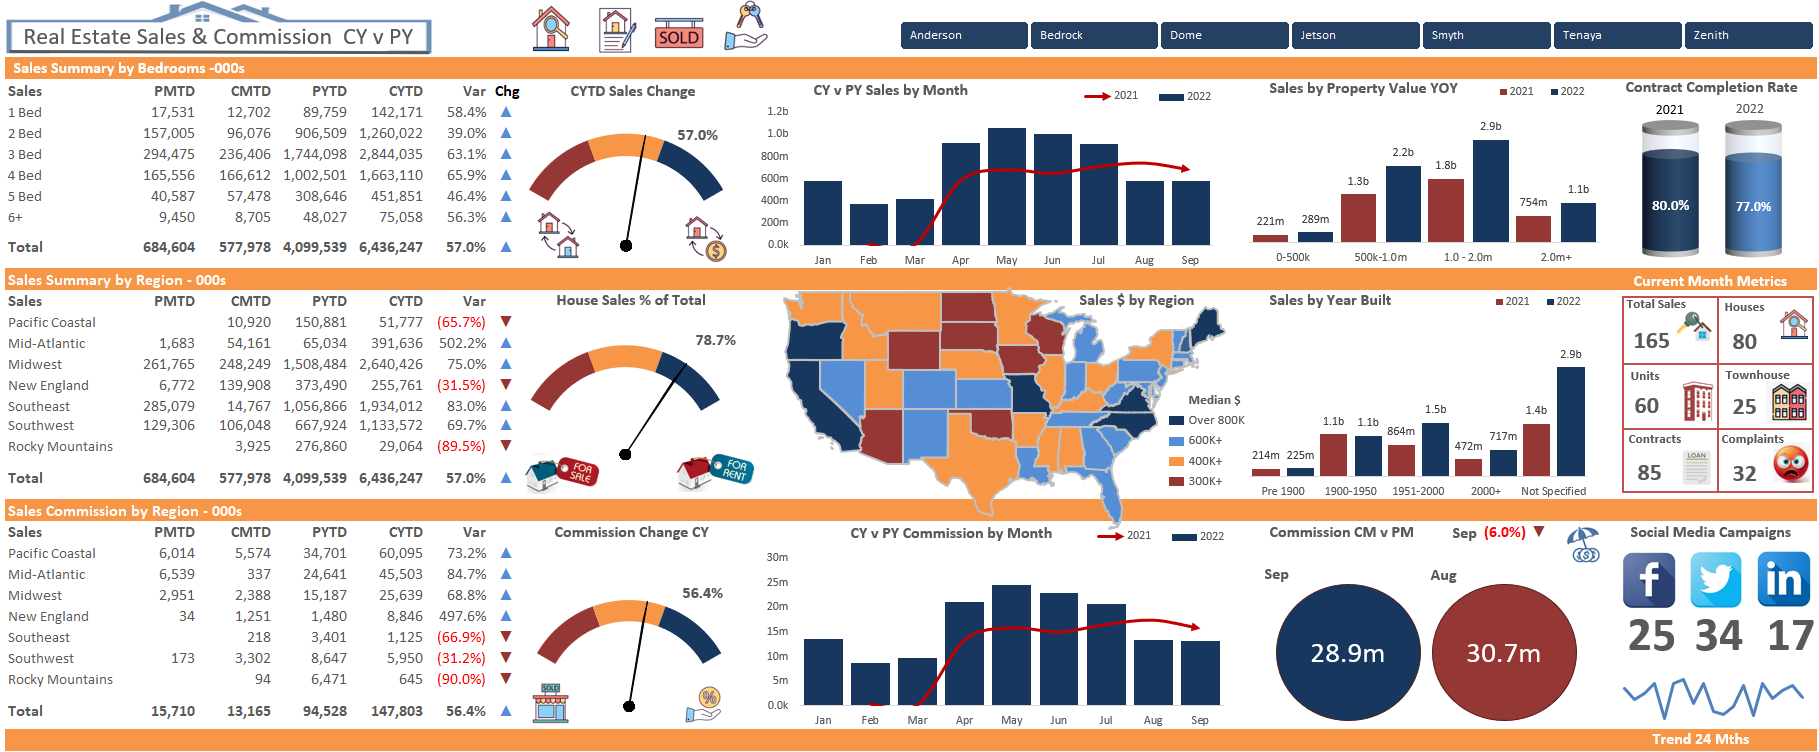

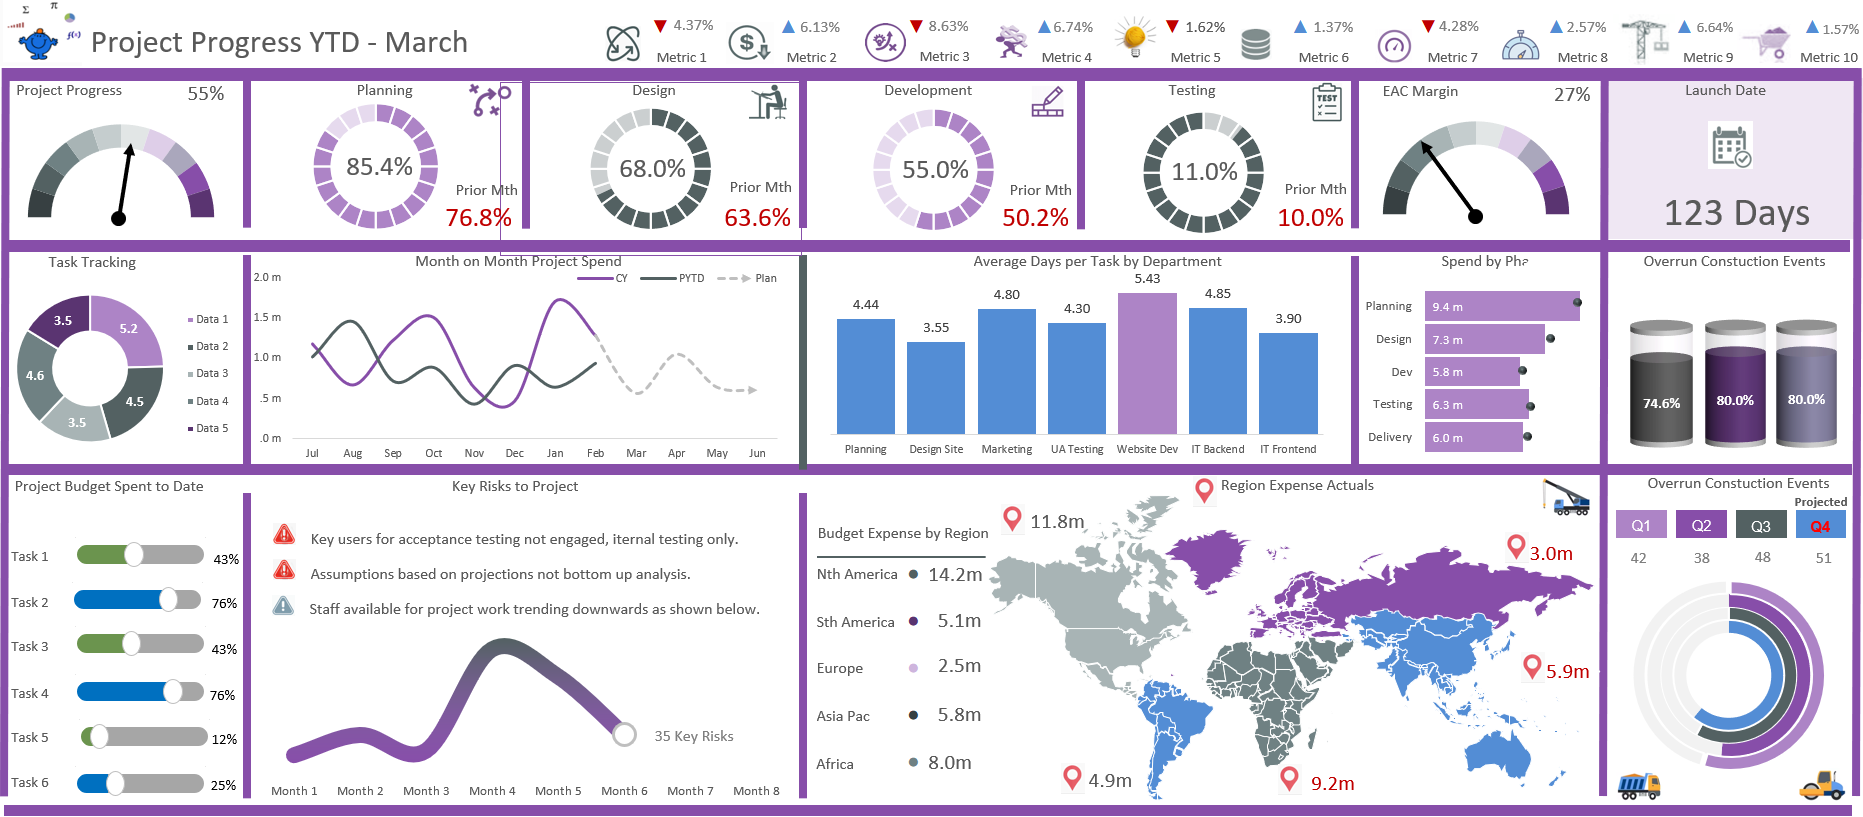
Project Tracking Dashboard
Project tracking dashboards are a great way to monitor the progress of a project over time. This is an example of a well laid out dashboard with a number of key operational metrics.
Read More
Excel Unique Formula
The UNIQUE formula has really changed the game in Excel as a way to interrogate a list and return all of the unique items in that list.
Read More
Horizontal Range to Vertical Range in Excel
With the advent of Power Pivot the task of flipping data is made very simple. The Unpivot Other Columns command is a bit of a game changer. It easily moves data from horizontal to the more database friendly vertical range very nicely.
Read More
Cascading Combo Boxes 3 and 4 Layer
Create 3 and 4 level dynamic lists into an Excel data validation on the fly by managing a vertical list with no named ranges. This is the data validation list management tool you have been looking for.
Read More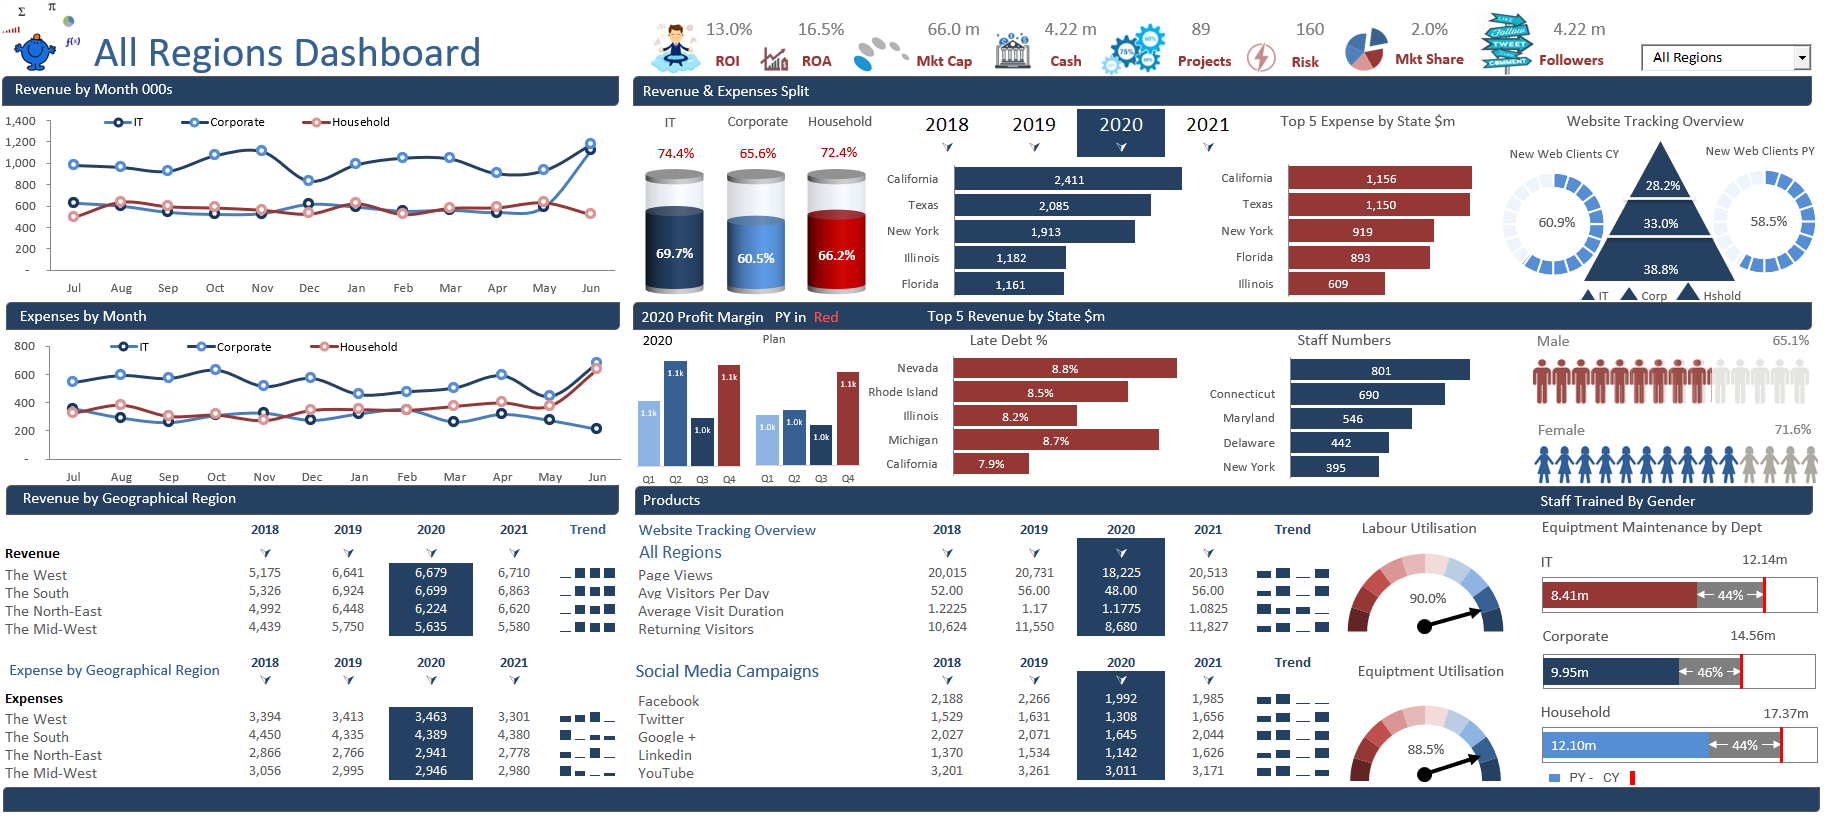
Dashboard Upgrade
This is a new Excel Dashboard from an older dashboard I have upgraded. The transformation is complete.
Read More
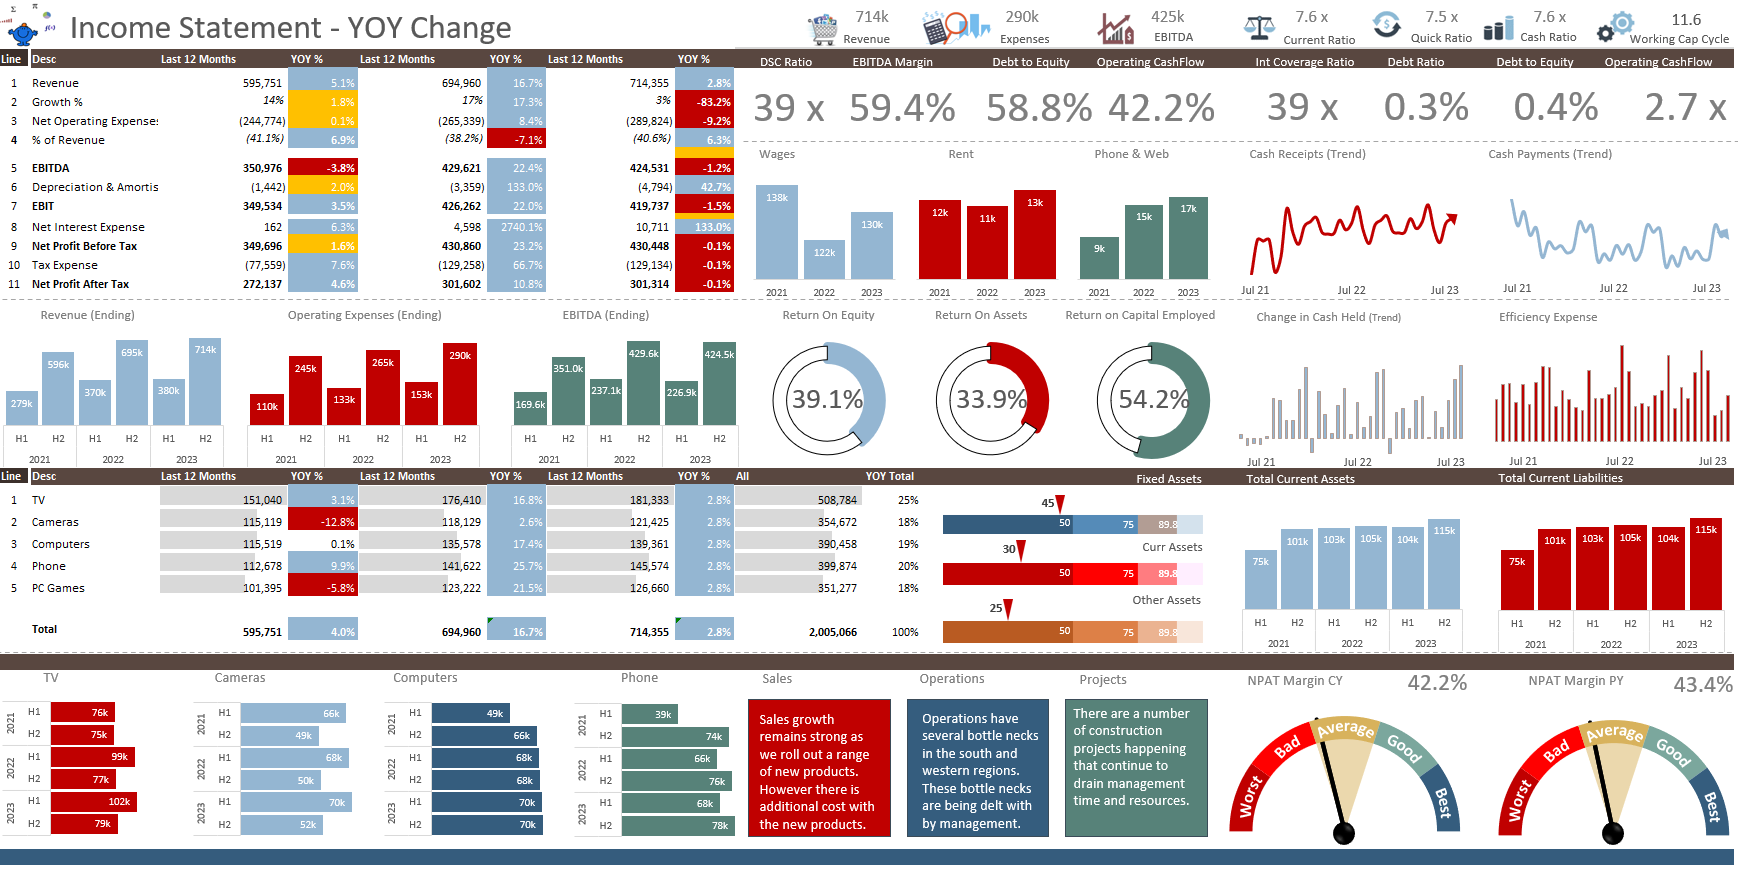
Excel Dashboard Charting with Shapes
An Excel dashboard created using excel charts in the form of shapes. It compares data from prior periods with actual data in a beautiful final output.
Read More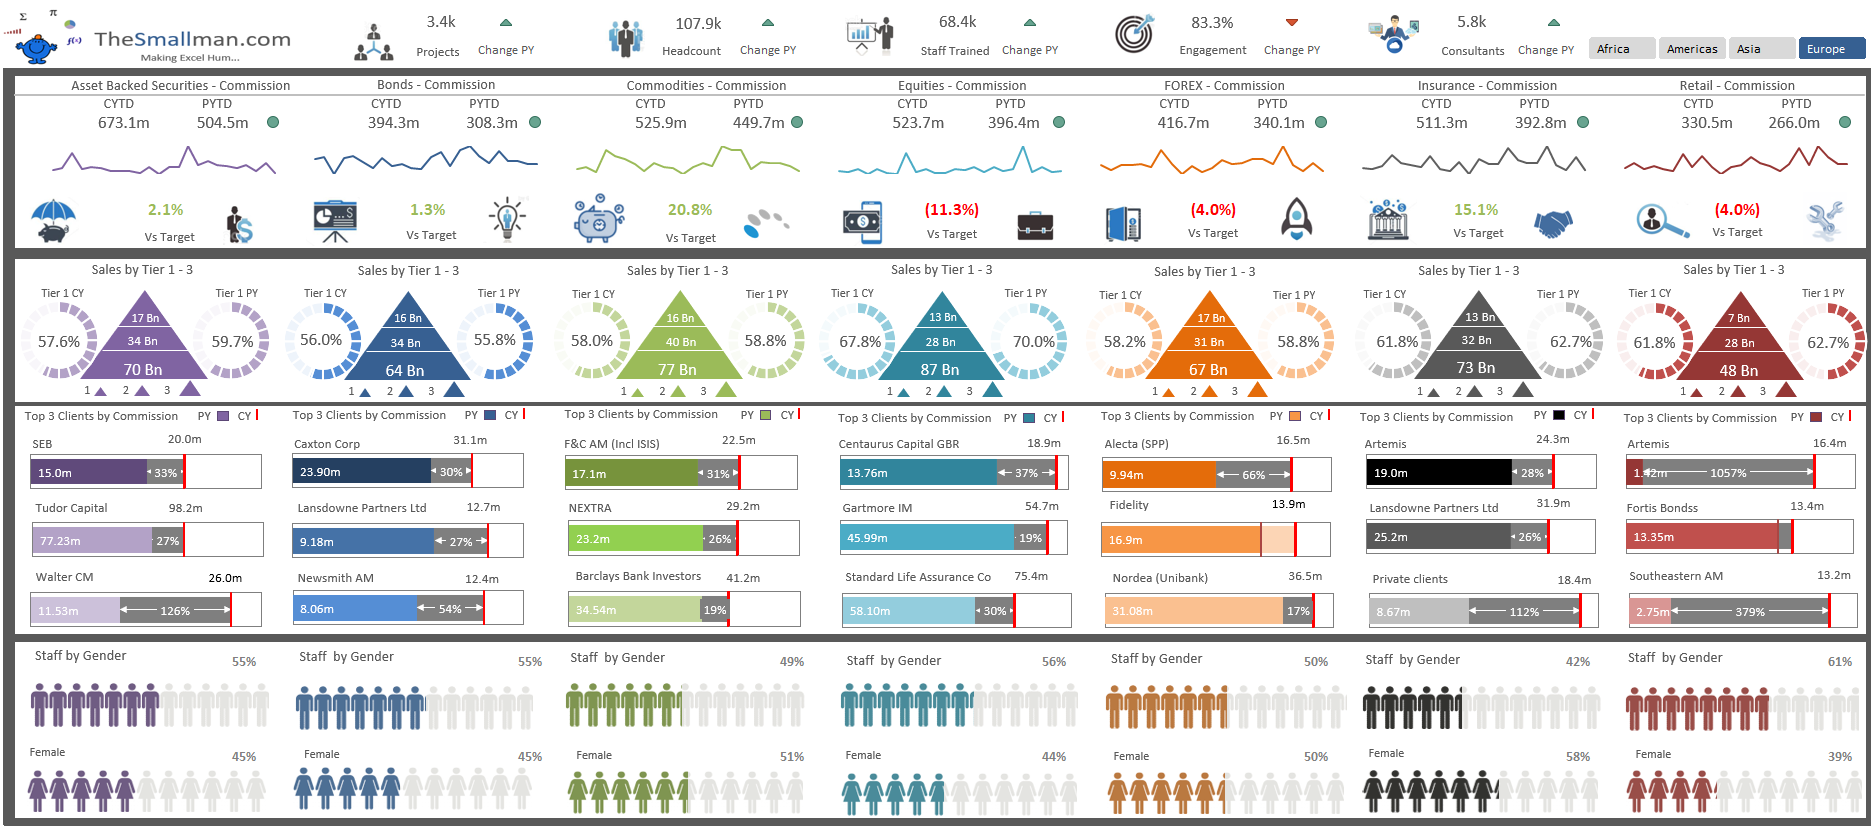
Excel Dashboard Example
This Excel dashboard is a summary of seven departments within a banking environment. It summarises the financial performance by region showing sales, commission, performance against plan and prior year to data and some human resources metrics by each department.
Read More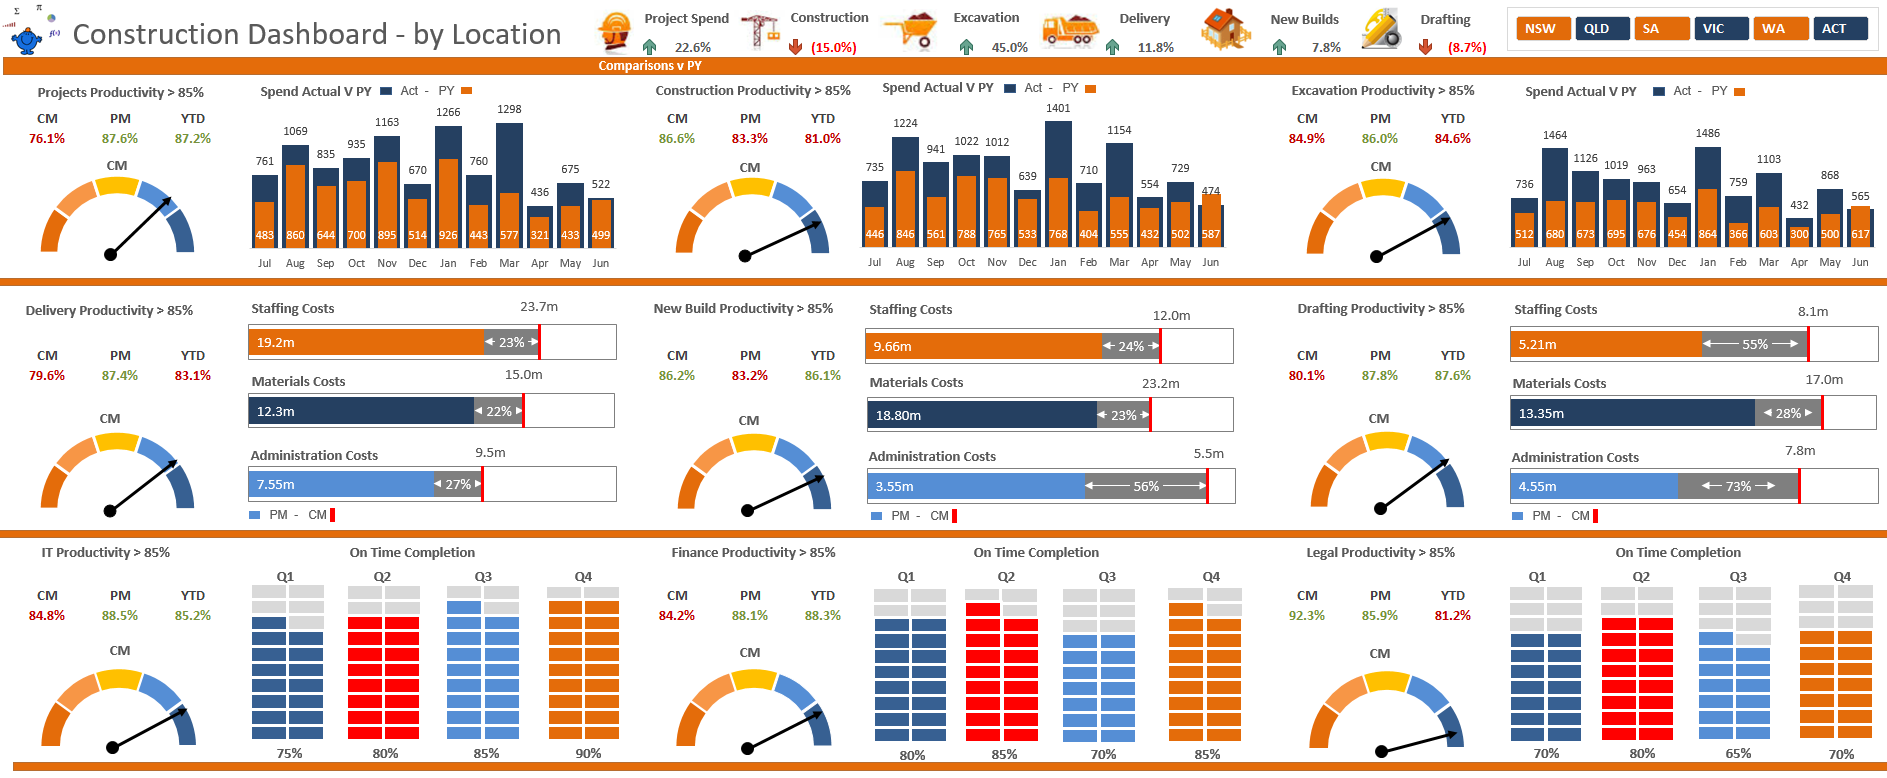
Excel Dashboard Designs
An Excel dashboard split into three levels the dashboard displays information by state and gives some of the key performance indicators for each of the business areas.
Read More
Transfer Data Between Arrays with VBA
Transfer data in a VBA range into an array and then output part of the array into another array. Push the information back into Excel seamlessly.
Read More

Excel vba Scripting Dictionary
The Excel scripting dictionary from the ground up. This blog post explains how the dictionary interacts with practical examples with an explanatory video series .
Read More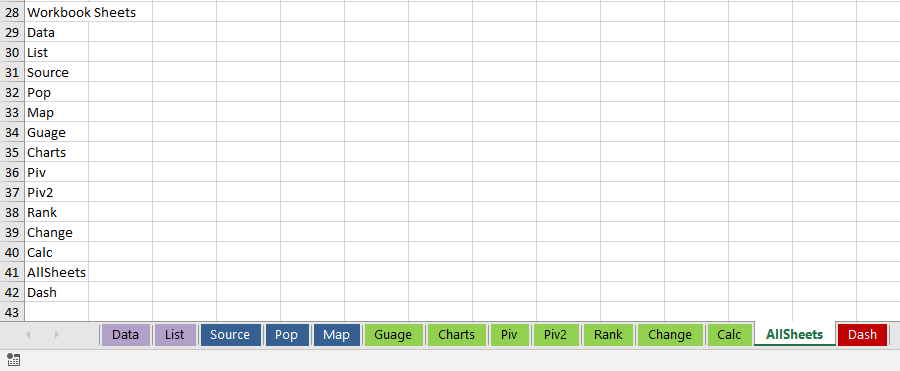
List All Sheets in a Excel Workbook
Creating worksheet tab names in a distinct and uneatable list is a tedious task. Using Excel VBA is the answer to this problem.
Read MoreFeatured Posts

Recent Posts
Inflation Over Multiple Years in a Single Cell January 10, 2025

Hubspot Dashboard October 3, 2024
Monthly Dashboard With Supporting Metrics September 25, 2024

Excel Show Missing Sheet Tabs July 29, 2024

Run Macro Overnight Automatically June 24, 2024
Split File into Parts and Save to Directory April 20, 2024
Most Popular Author December 14, 2023
Creating an Excel Dashboard - A Guide with Templates December 8, 2023
Real Estate Excel Dashboard October 11, 2023

Updating Excel Dashboards September 29, 2023