

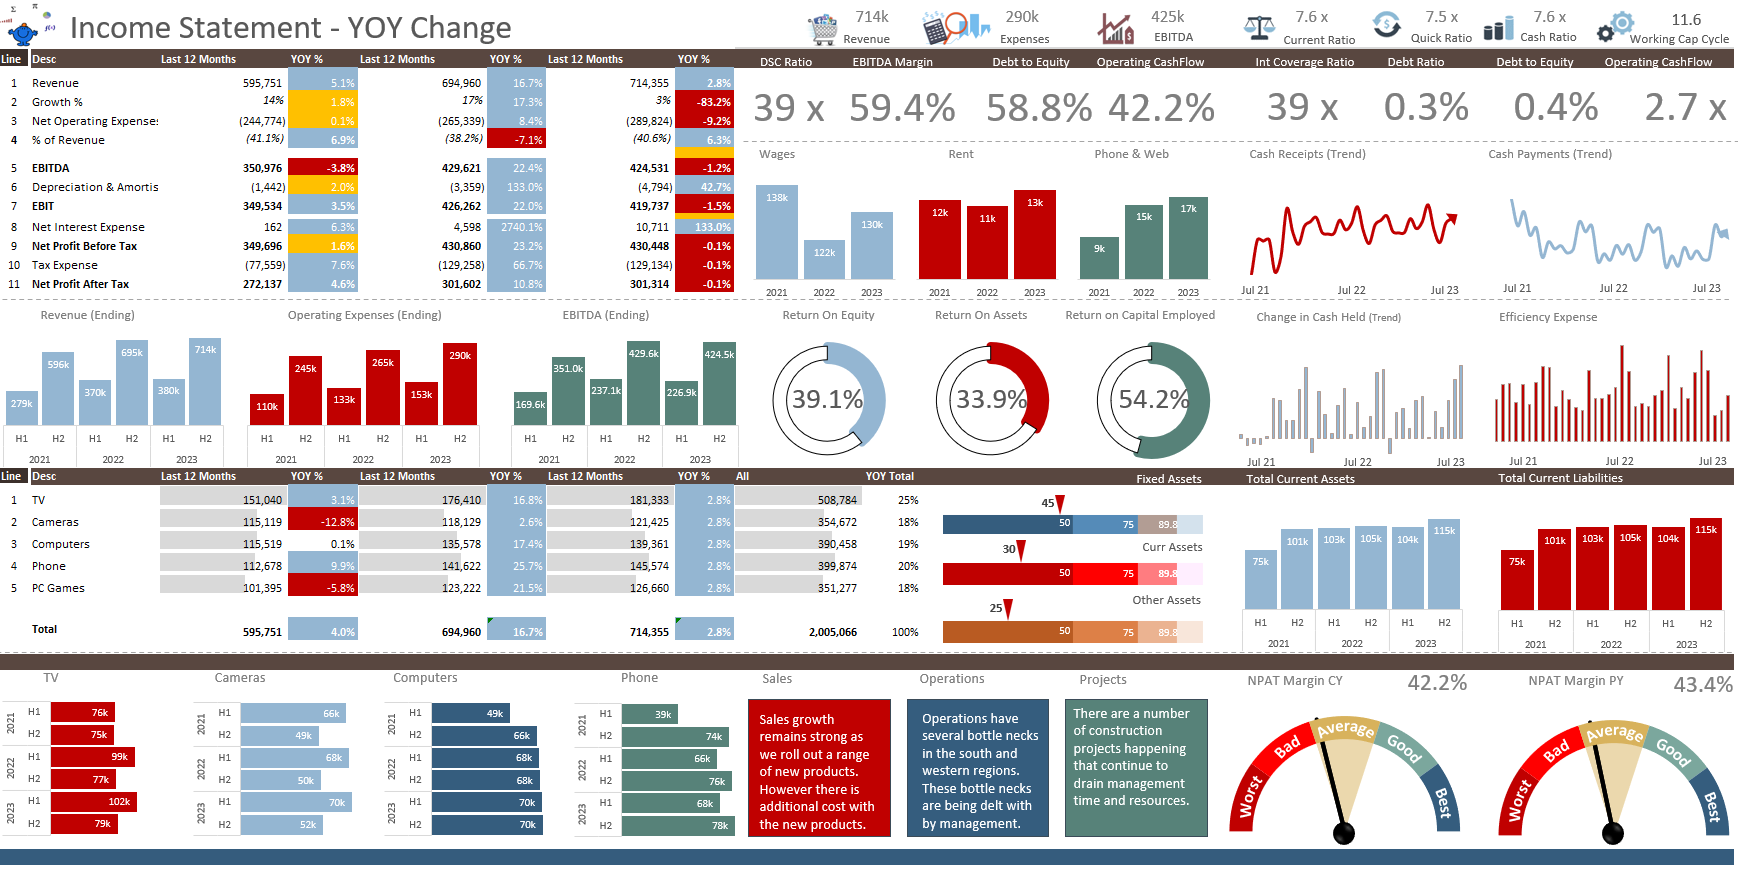
Excel Dashboard Charting with Shapes
An Excel dashboard created using excel charts in the form of shapes. It compares data from prior periods with actual data in a beautiful final output.
Read More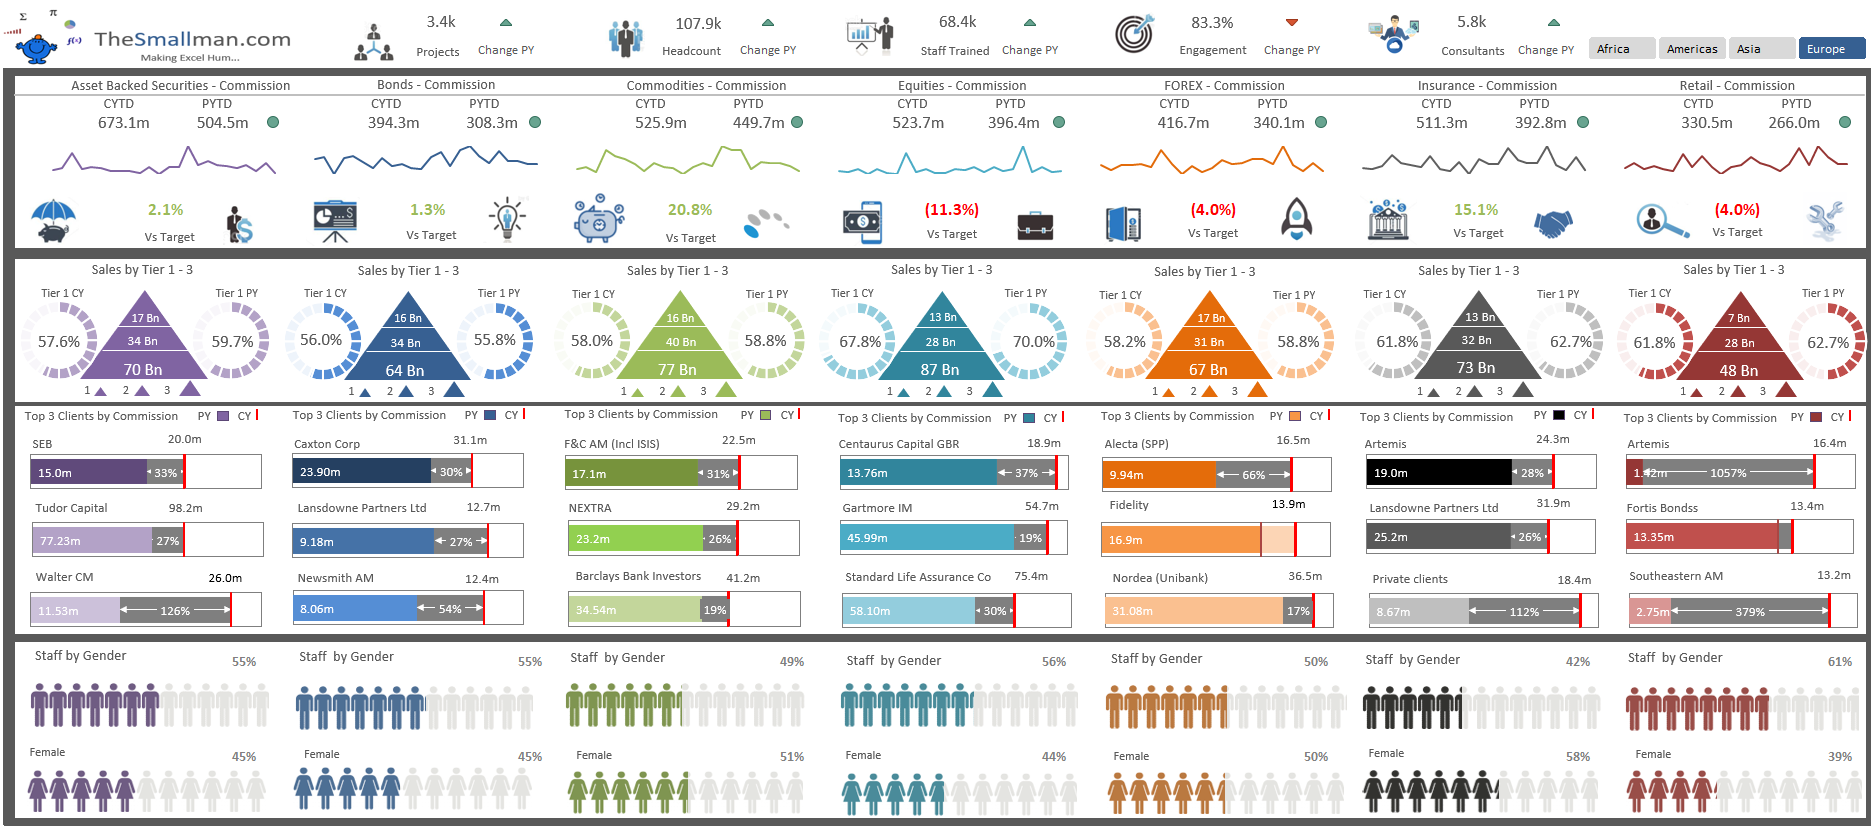
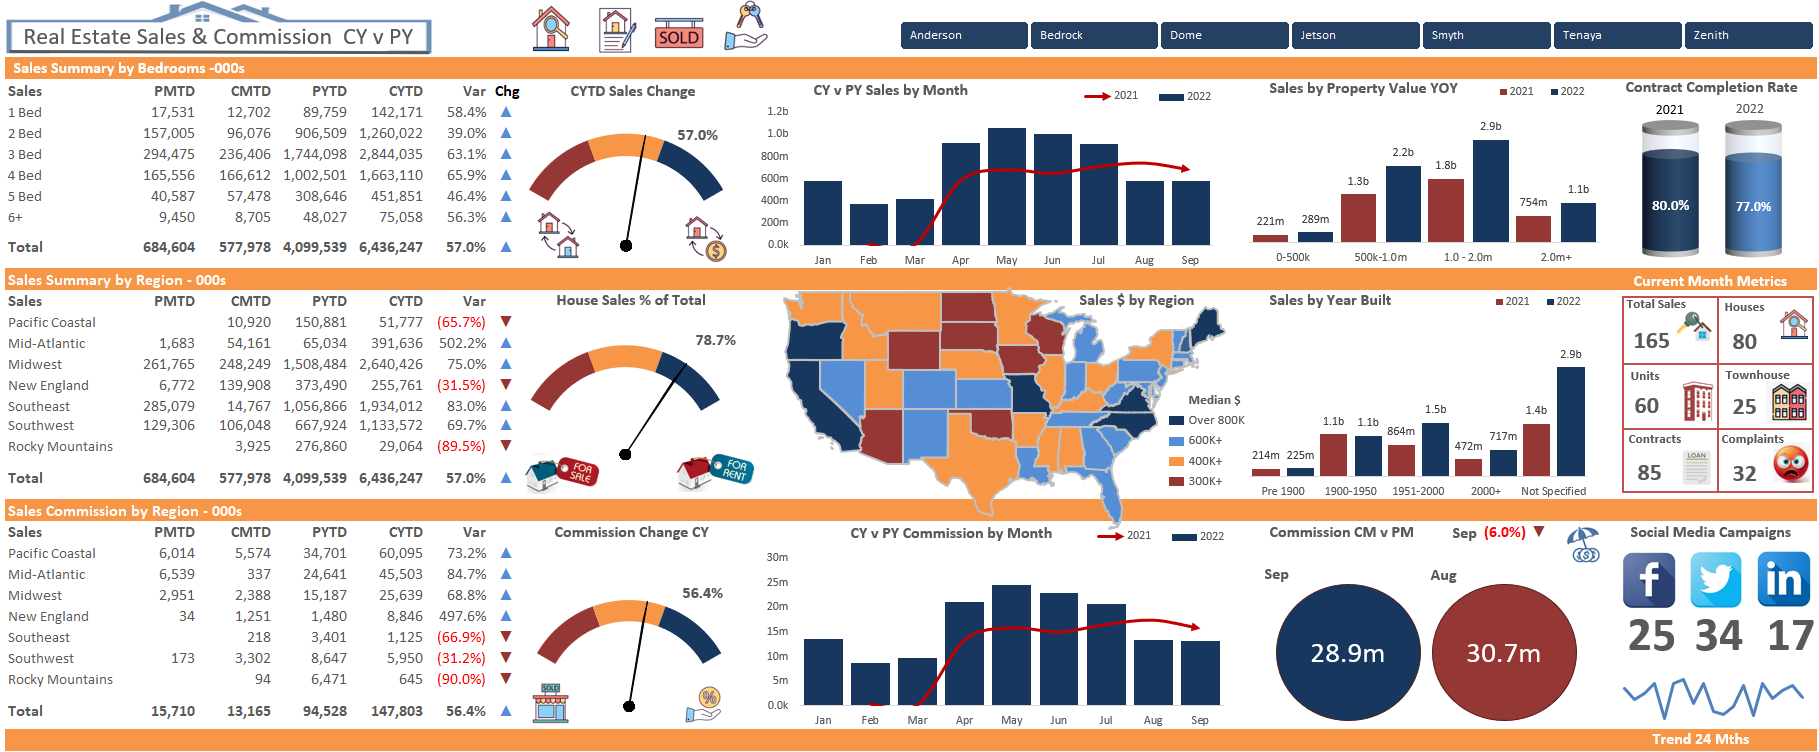
Excel Dashboard Example
This Excel dashboard is a summary of seven departments within a banking environment. It summarises the financial performance by region showing sales, commission, performance against plan and prior year to data and some human resources metrics by each department.
Read More
Excel Dashboards: Tracking a Crisis
A free Excel Dashboard webinar on how to build a data tracking document from scratch. It is a highly interactive Excel dashboard that has automation embedded into it.
Read More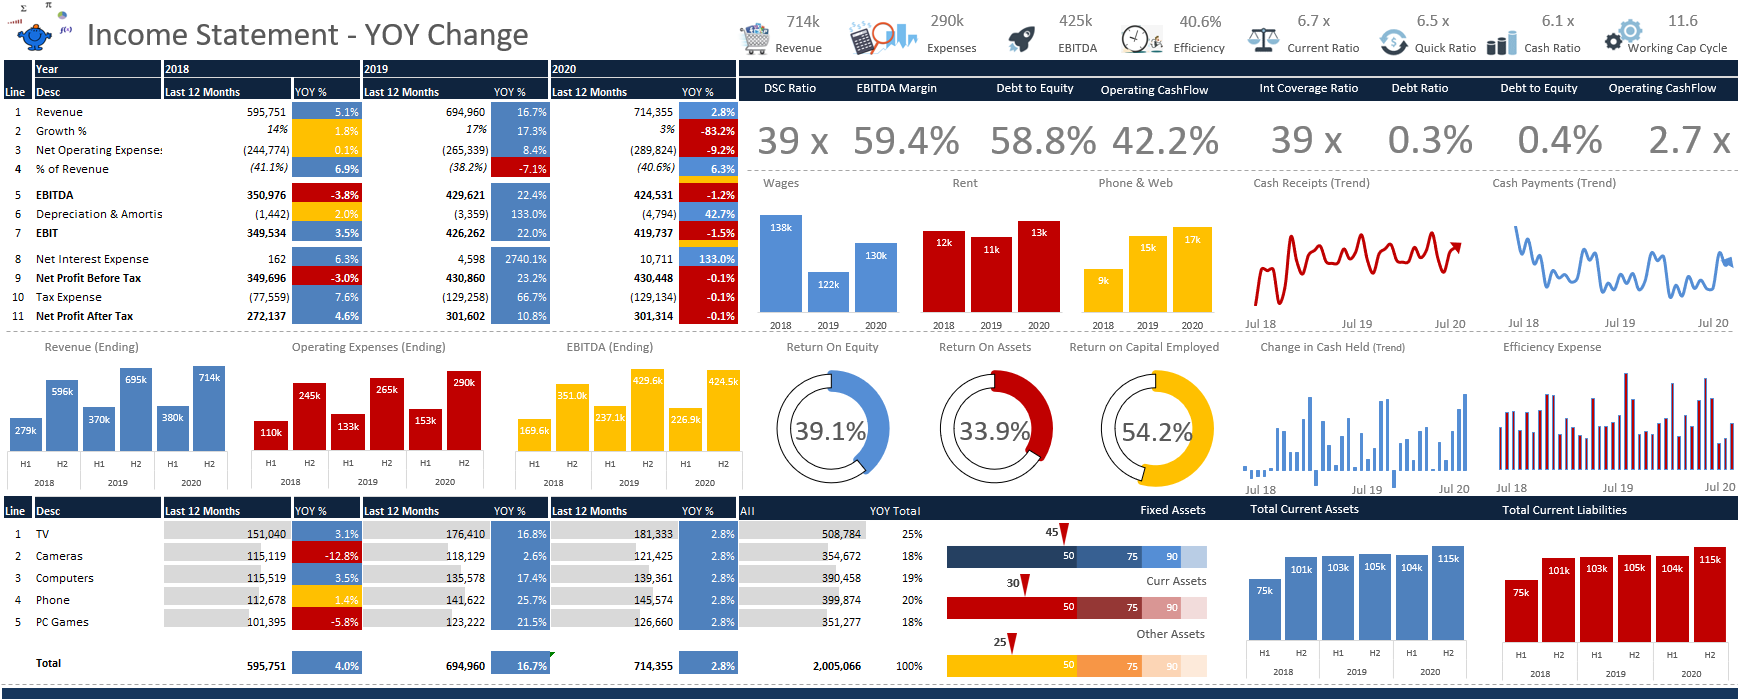
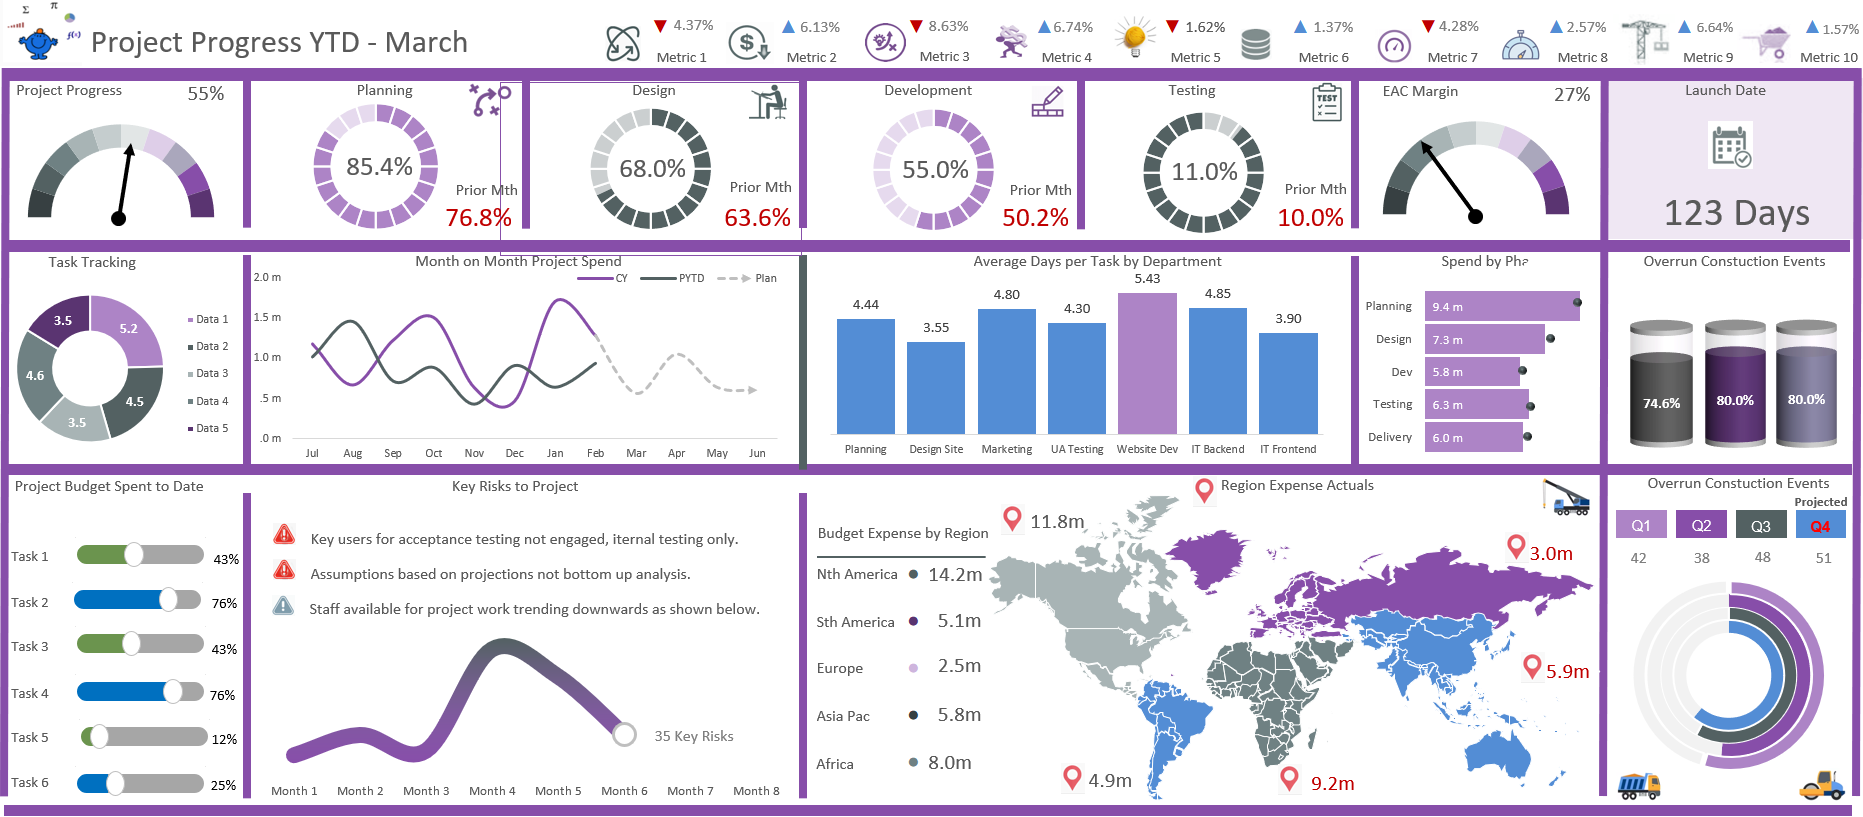
Telling a Story with an Excel Dashboard
Inspiring Excel dashboards that are functional and tell a compelling story.
Read More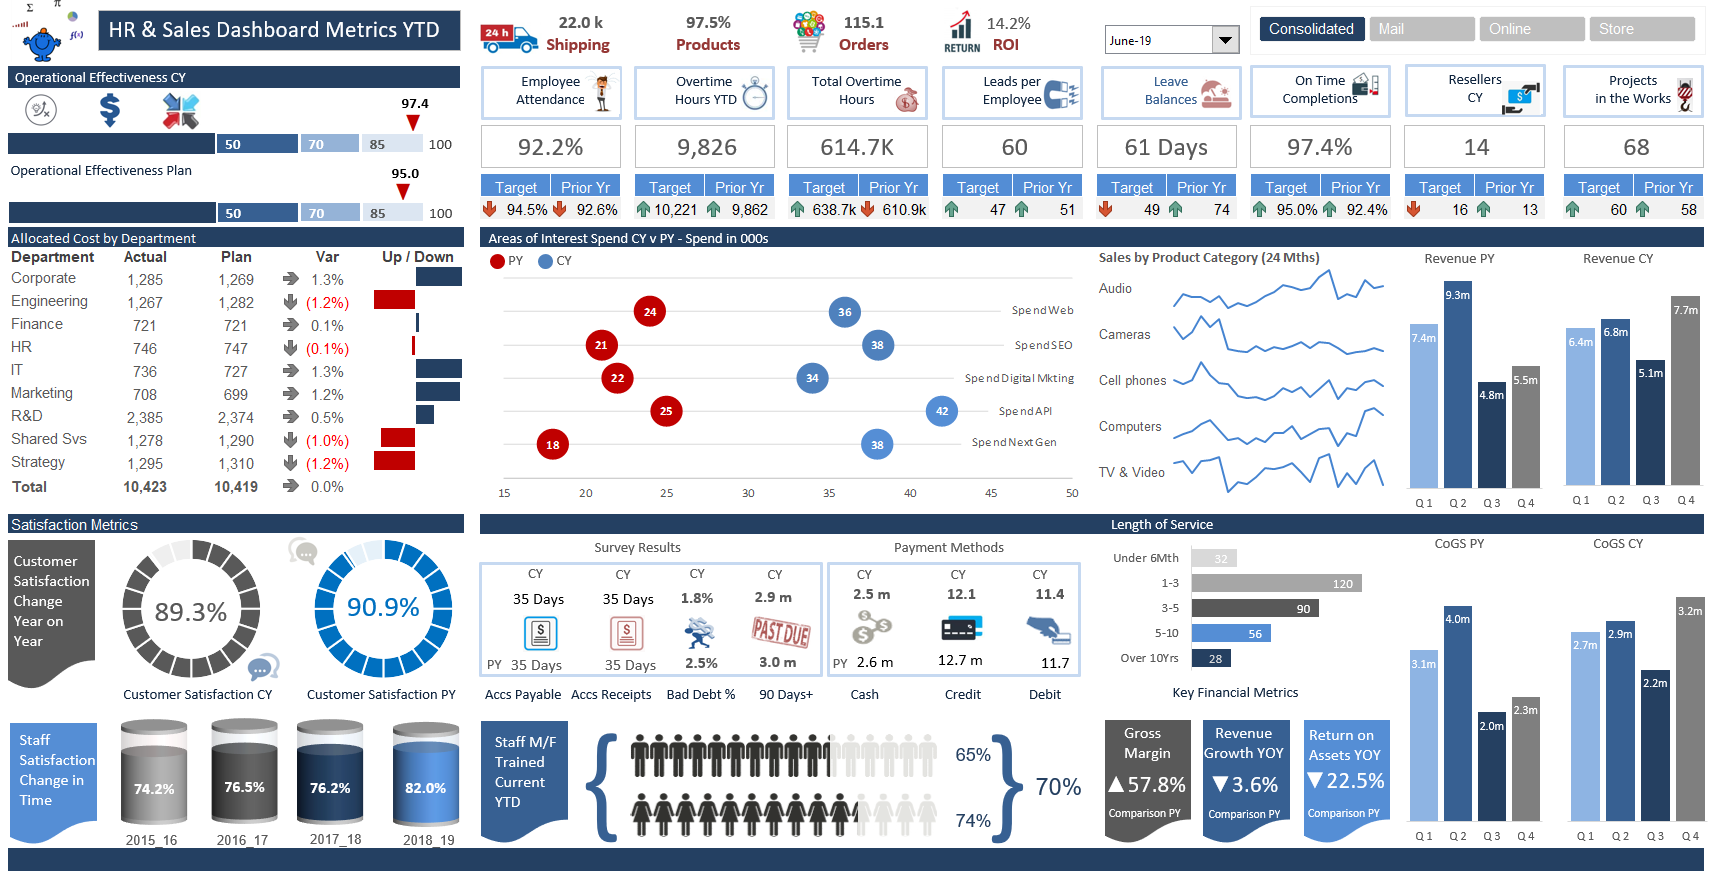
Excel Dashboard Reports and Courses
Excel Dashboards can make life a lot easier when they are ready made. Take the design and structural setup out of the dashboard process and purchase these premium Excel Dashboards.
Read More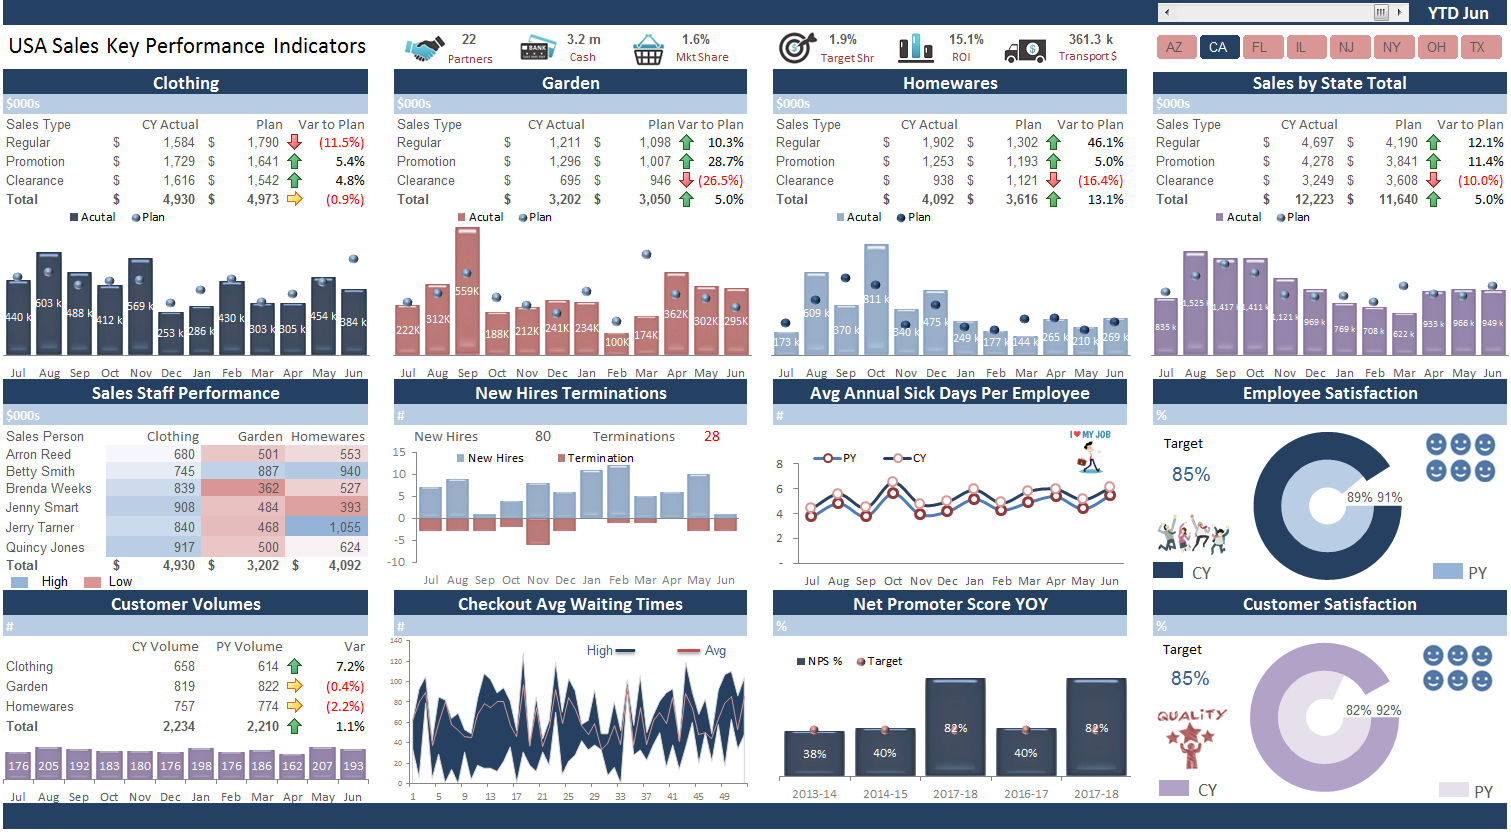
New Excel Dashboard Tools
This is a list of Excel dashboards - the best I have produced to date. These are time saving Excel tools which you can purchase from Eloquens.
Read More
The Fuzzy World of Financial Modelling
This post is about financial modelling, how to do it and what is important when it comes to manipulating Excel data.
Read MoreFeatured Posts
Recent Posts

Inflation Over Multiple Years in a Single Cell January 10, 2025

Hubspot Dashboard October 3, 2024

Monthly Dashboard With Supporting Metrics September 25, 2024

Excel Show Missing Sheet Tabs July 29, 2024

Run Macro Overnight Automatically June 24, 2024

Split File into Parts and Save to Directory April 20, 2024
Most Popular Author December 14, 2023
Creating an Excel Dashboard - A Guide with Templates December 8, 2023
Real Estate Excel Dashboard October 11, 2023

Updating Excel Dashboards September 29, 2023