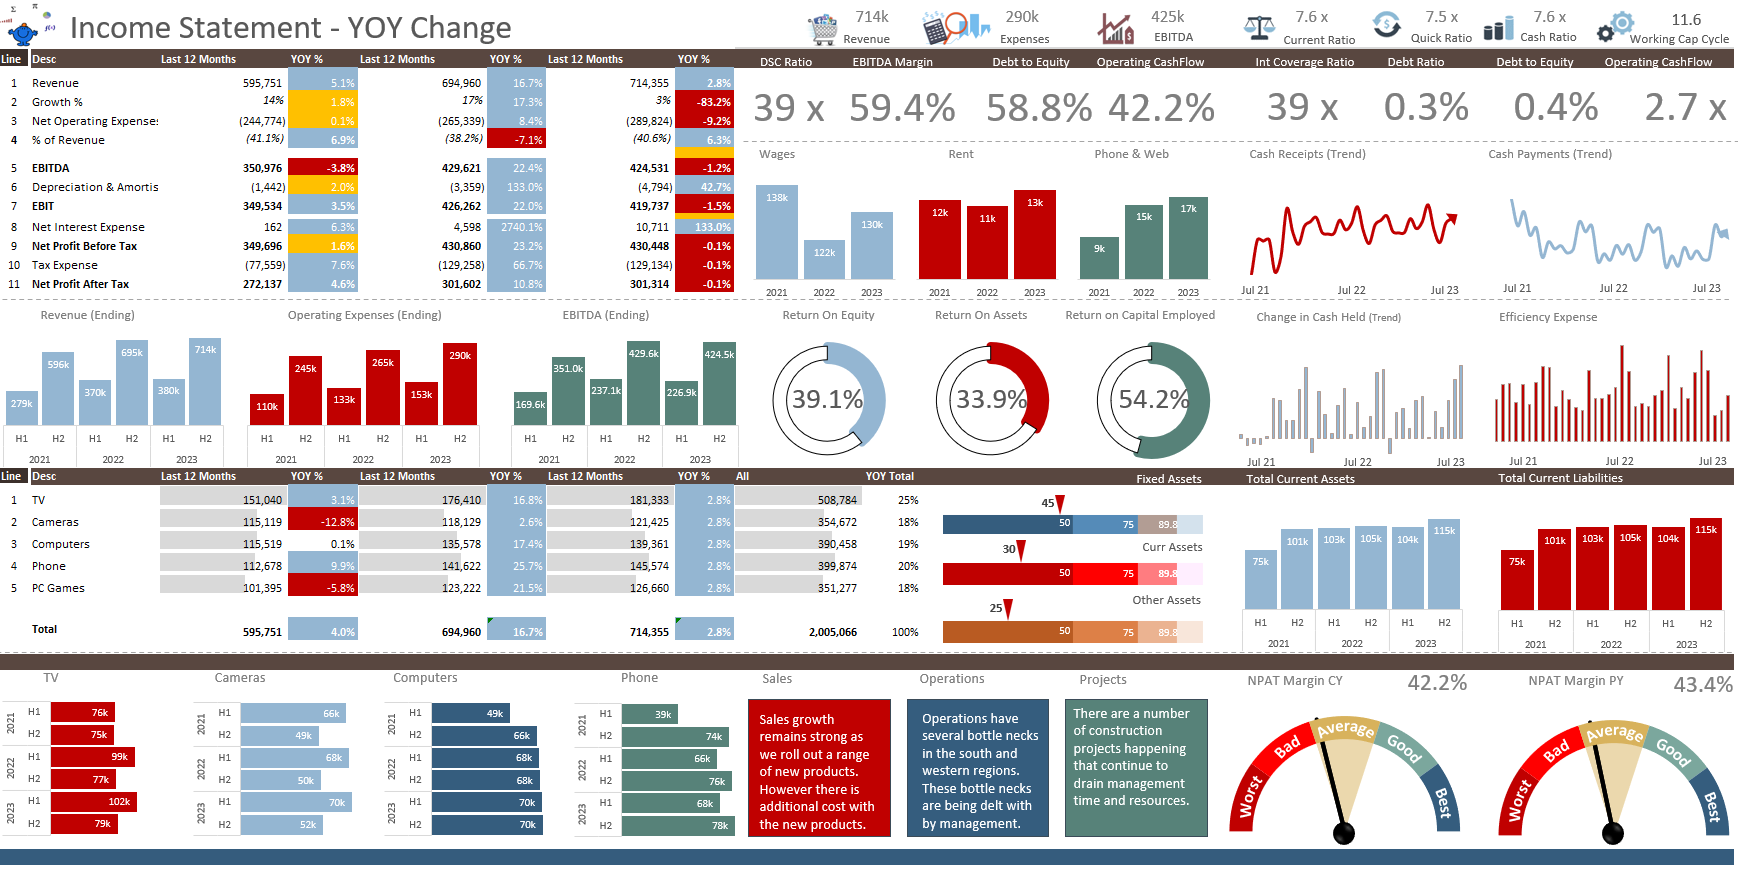
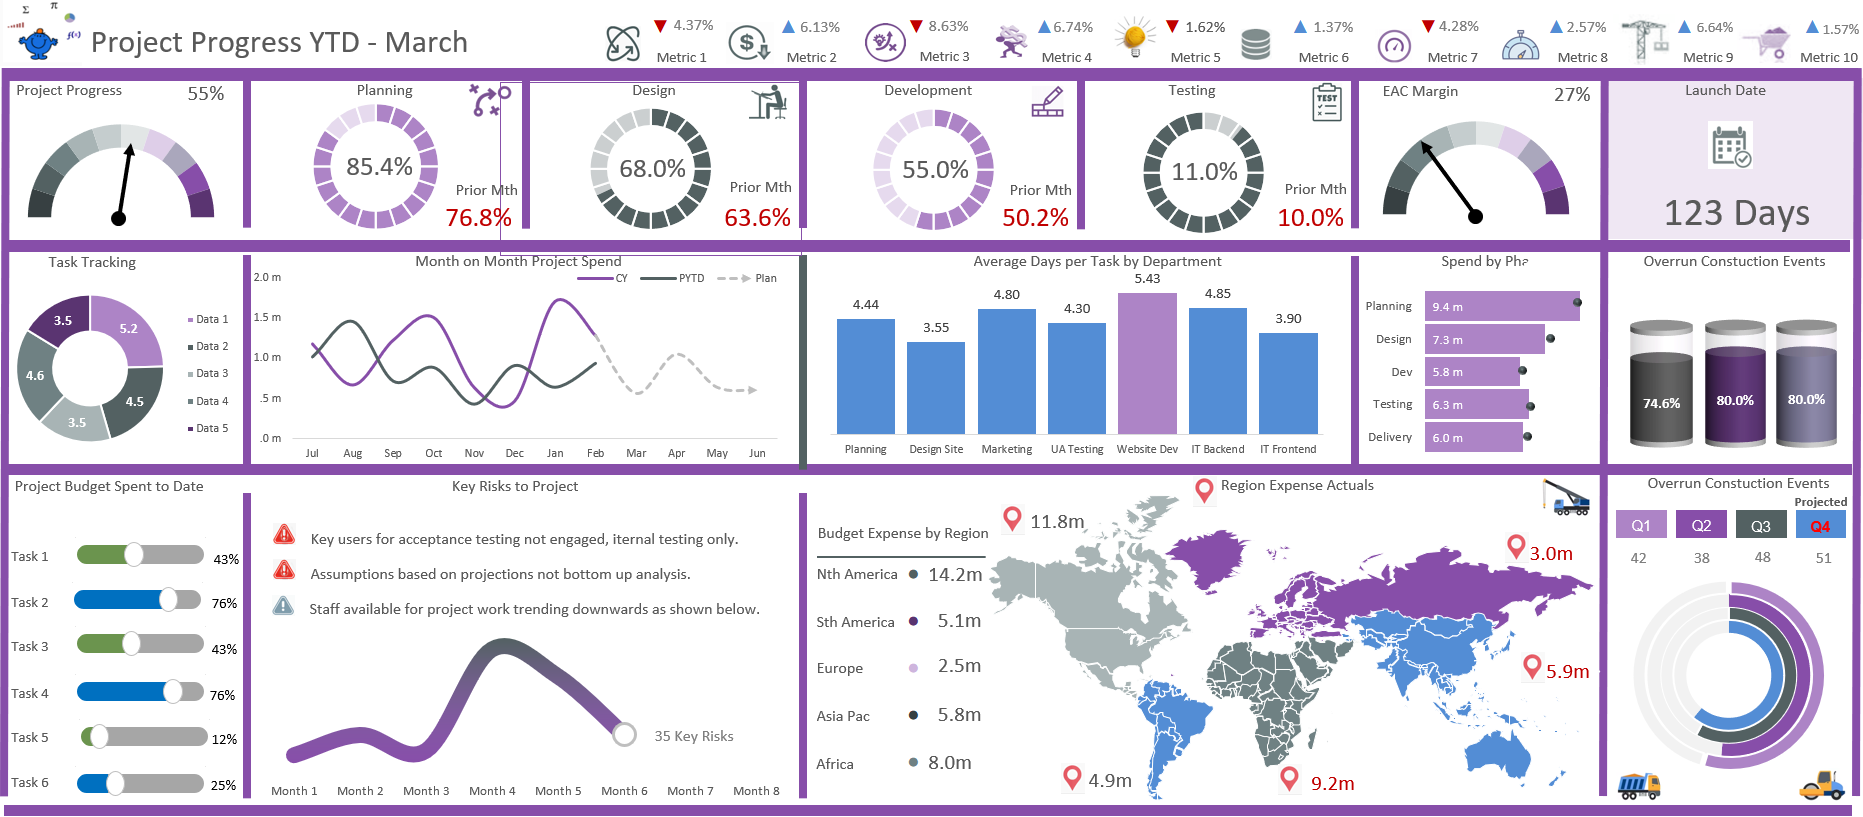
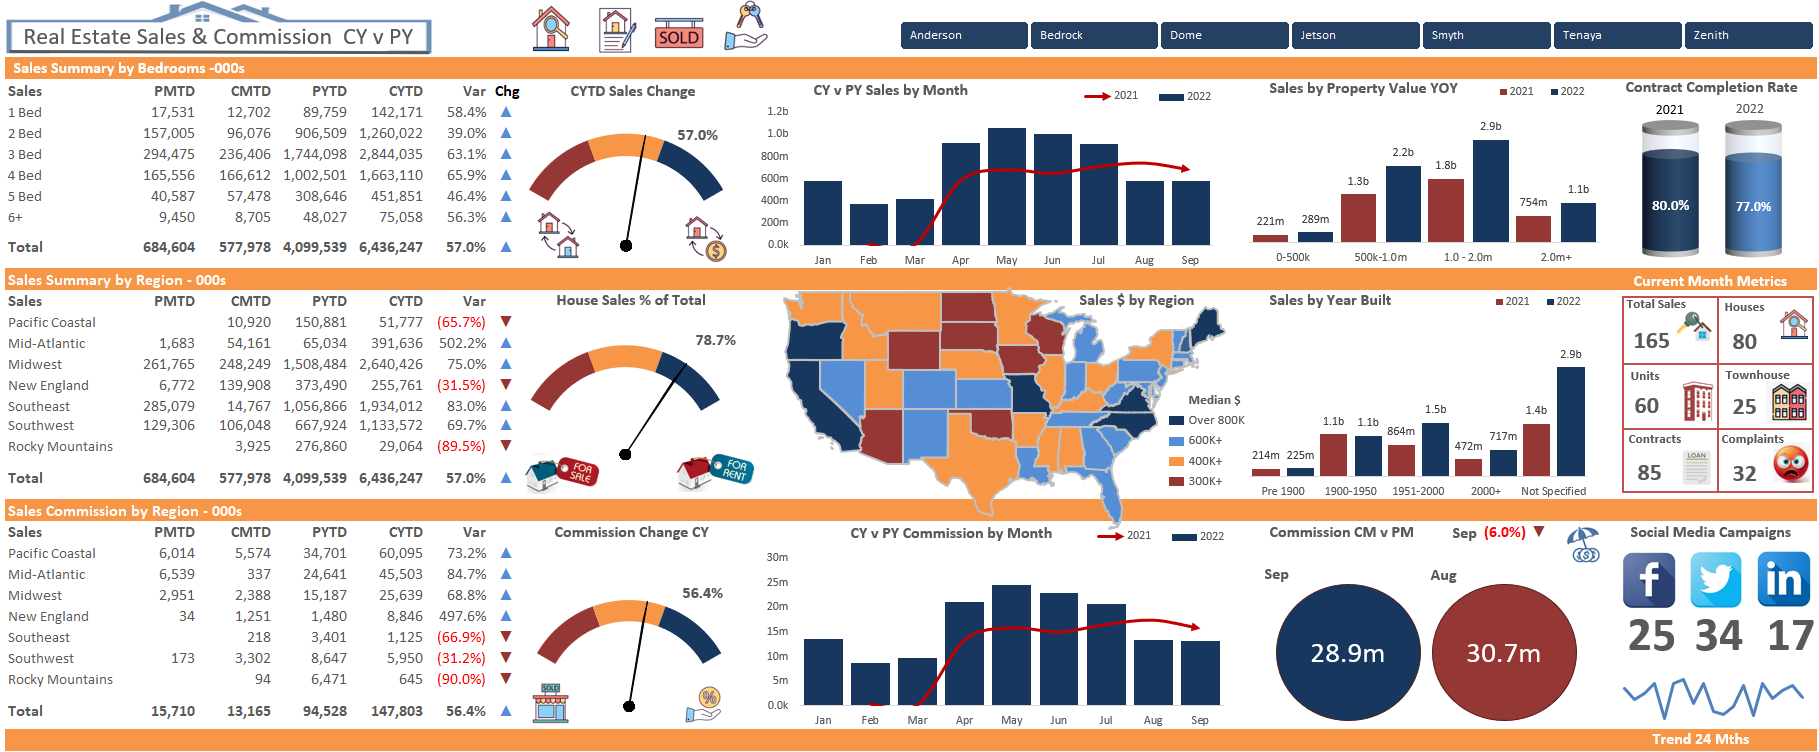
Over this holiday season my friend Lance Rubin wanted to create a Power BI prototype so I made my first cut in Excel and will be transferring the results to PBI in due course. The above would never fit into PBI but is a bit of fun with some of the results.
It started out with a small PBI dashboard I saw on Microsoft’s site and quickly developed into a 4 page dashboard which outlined one of Lance’s many 3 statement models. As I was developing the model it became easier to create each new page as the design was set up and I just needed to copy the format of the original. The numbers changed but the structure stayed the same. This is a good way to learn to create Excel dashboards, find a methodology and stick with it but remember to tweak and experiment with it. This way you are trying new things with a solid baseline.
Anyway the above is my final creation. Not a bad representation of the data in my opinion. Hope it inspires the creativeness in your work.


