

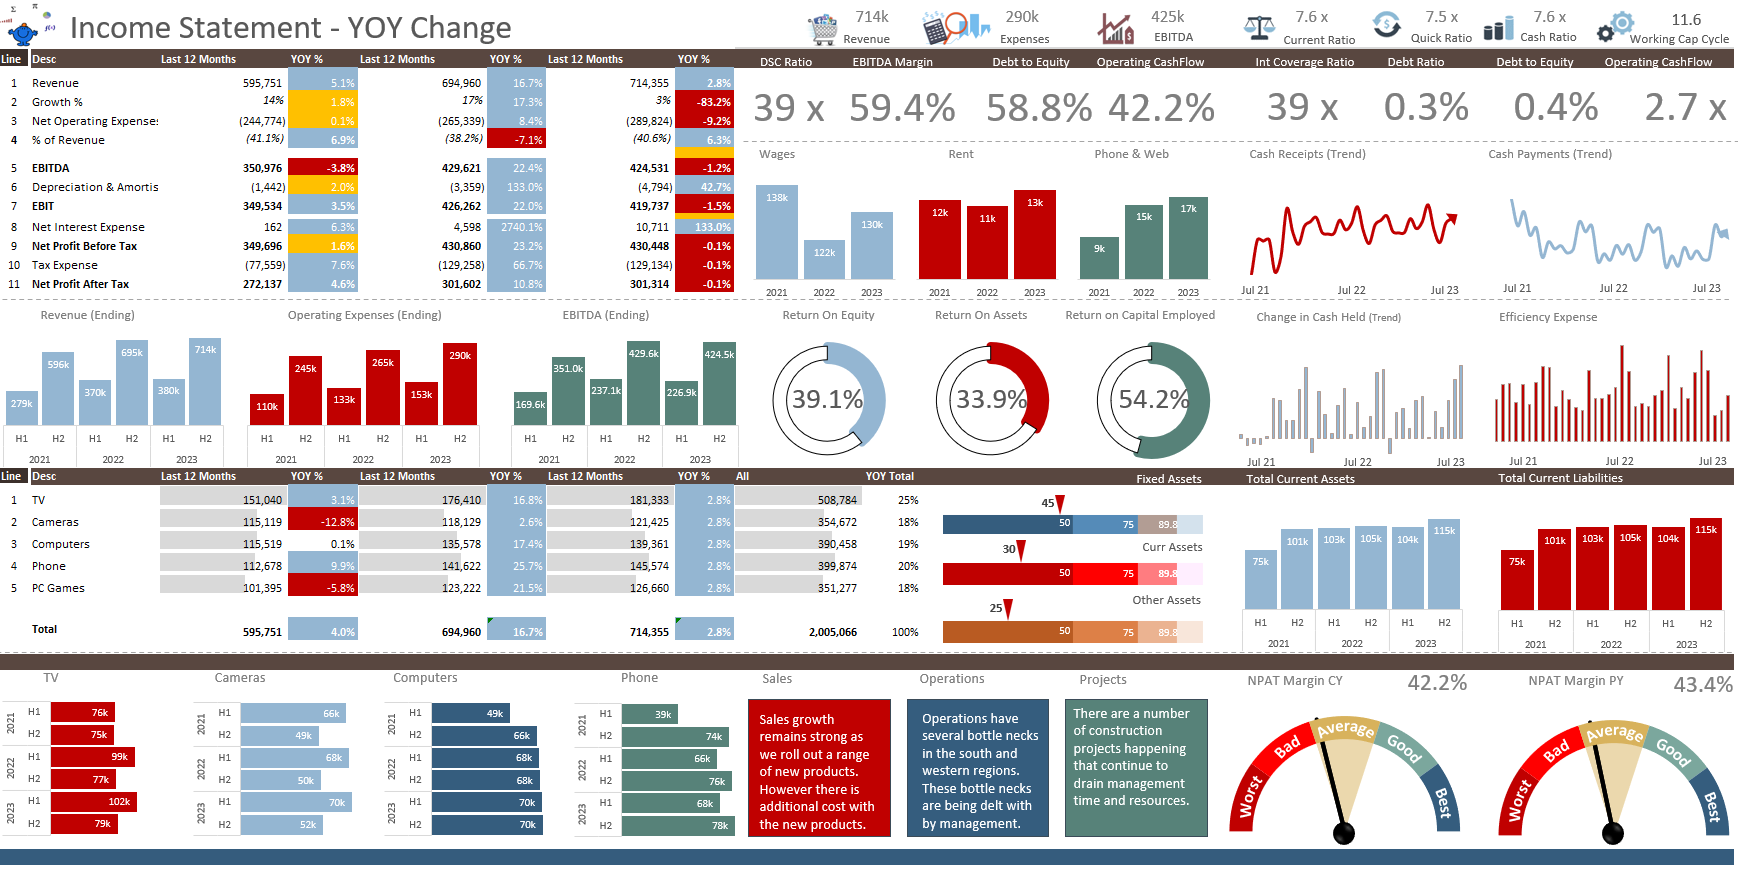
Monthly Dashboard With Supporting Metrics
A guide to dashboard design. Outlining several crucial phases that are involved in creating an Excel dashboard:
Read More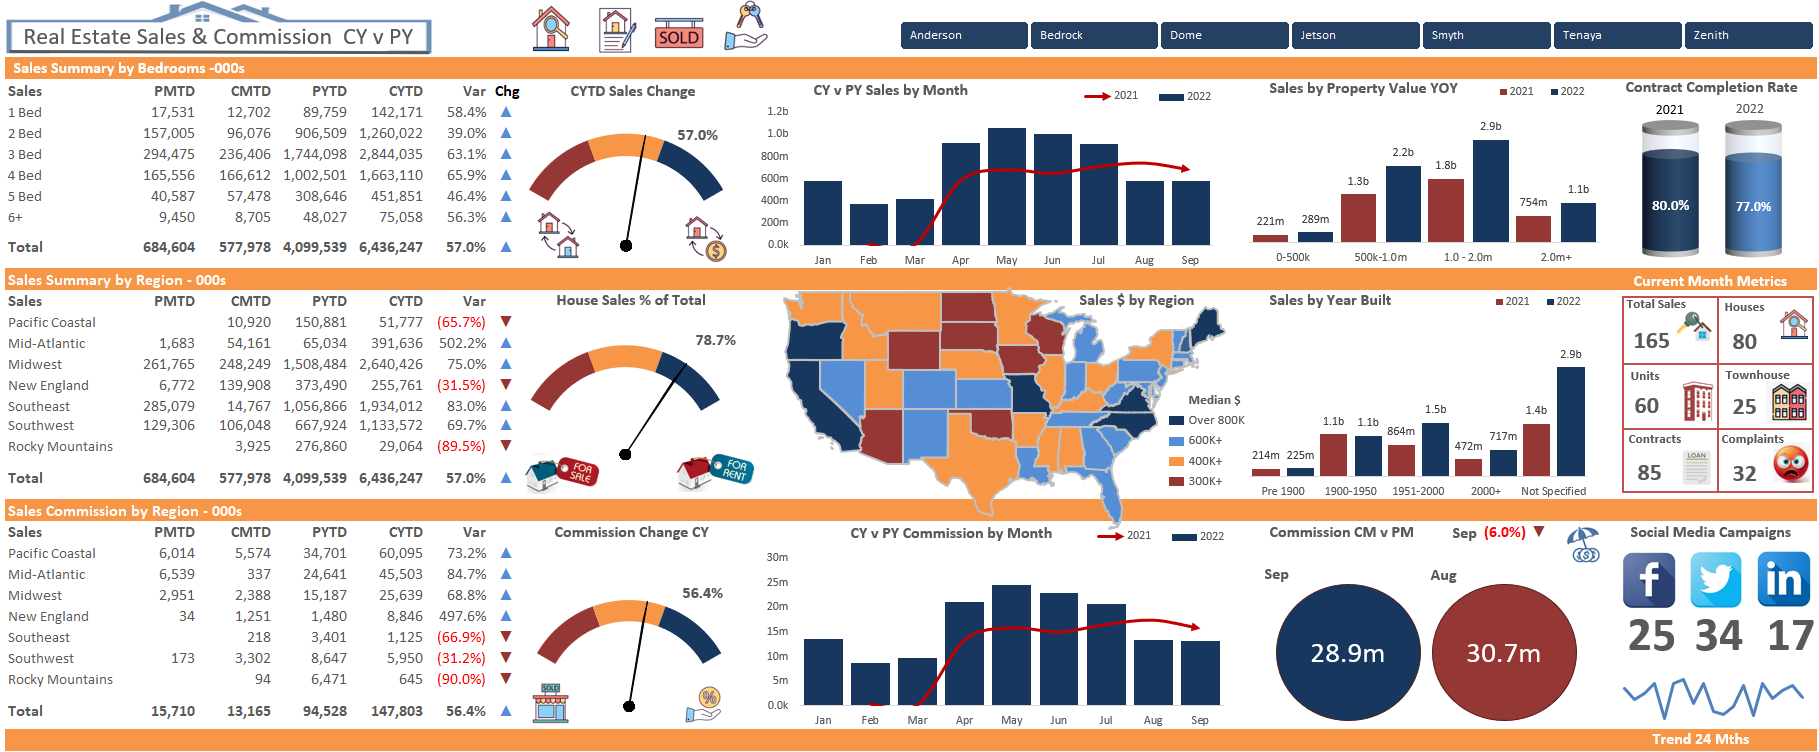

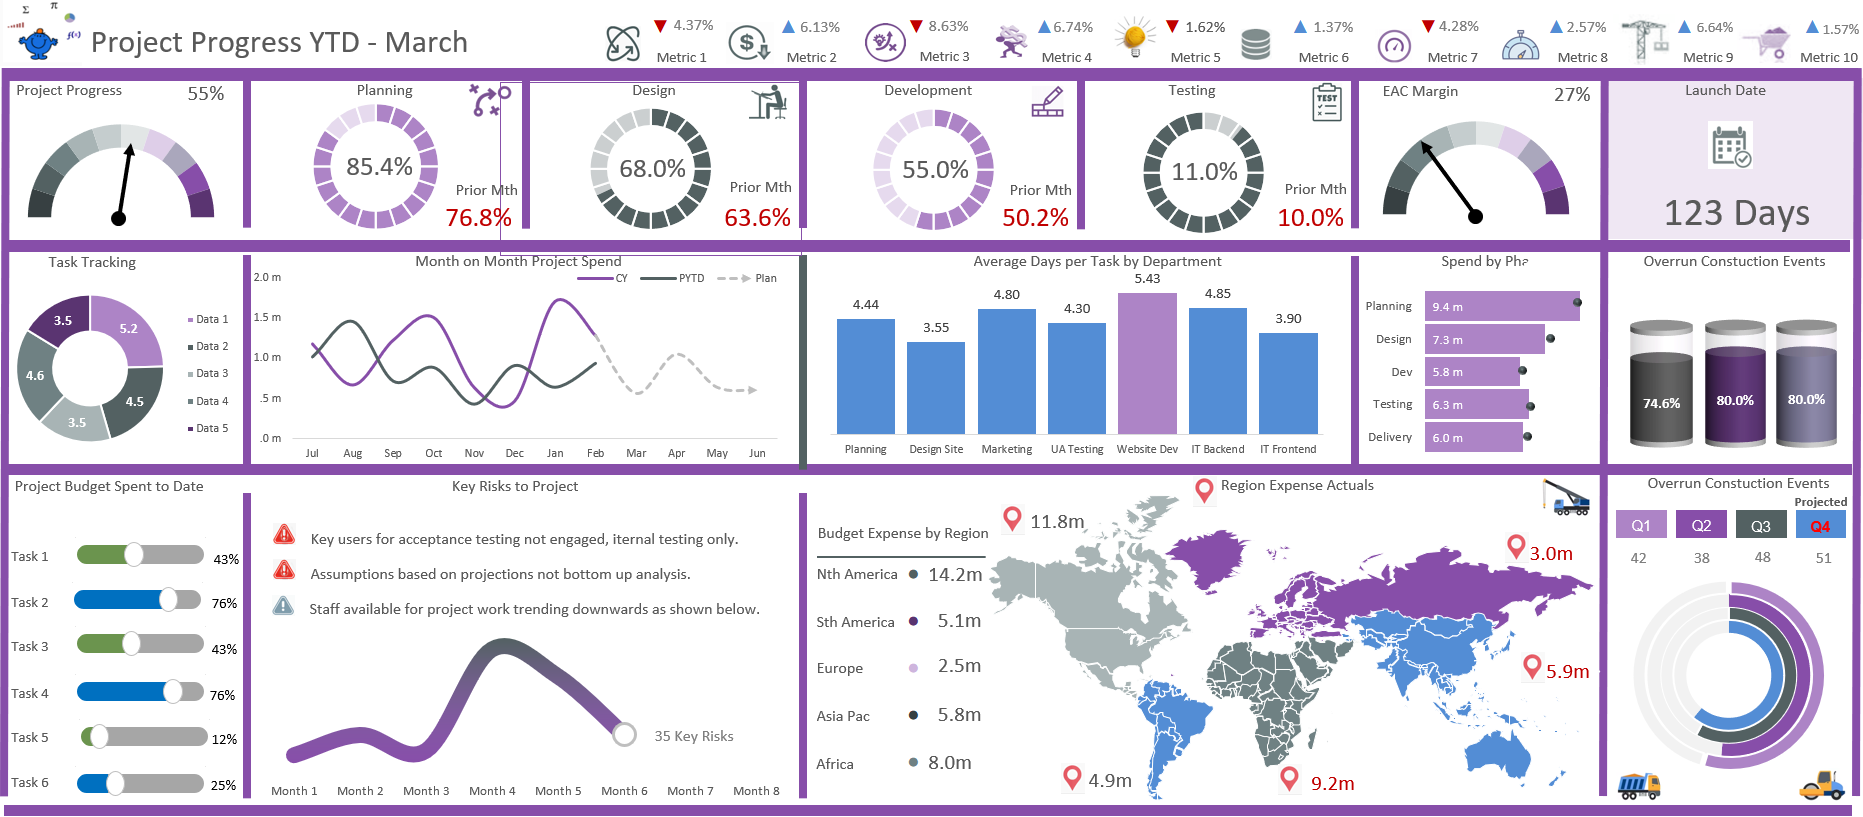
Project Tracking Dashboard
Project tracking dashboards are a great way to monitor the progress of a project over time. This is an example of a well laid out dashboard with a number of key operational metrics.
Read More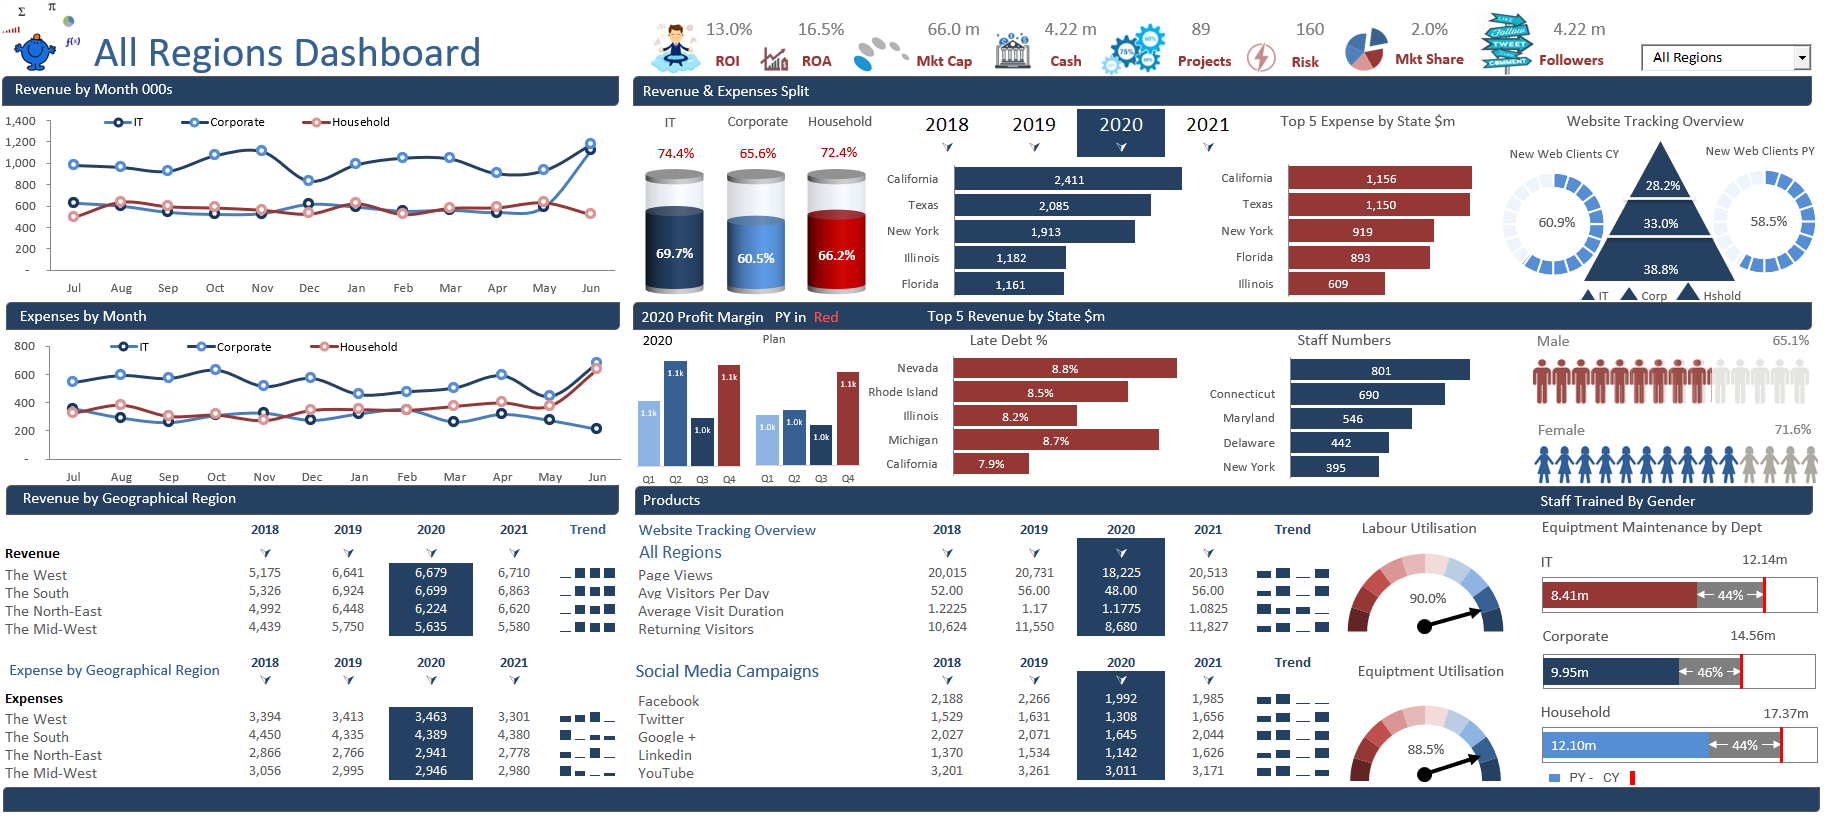
Dashboard Upgrade
This is a new Excel Dashboard from an older dashboard I have upgraded. The transformation is complete.
Read More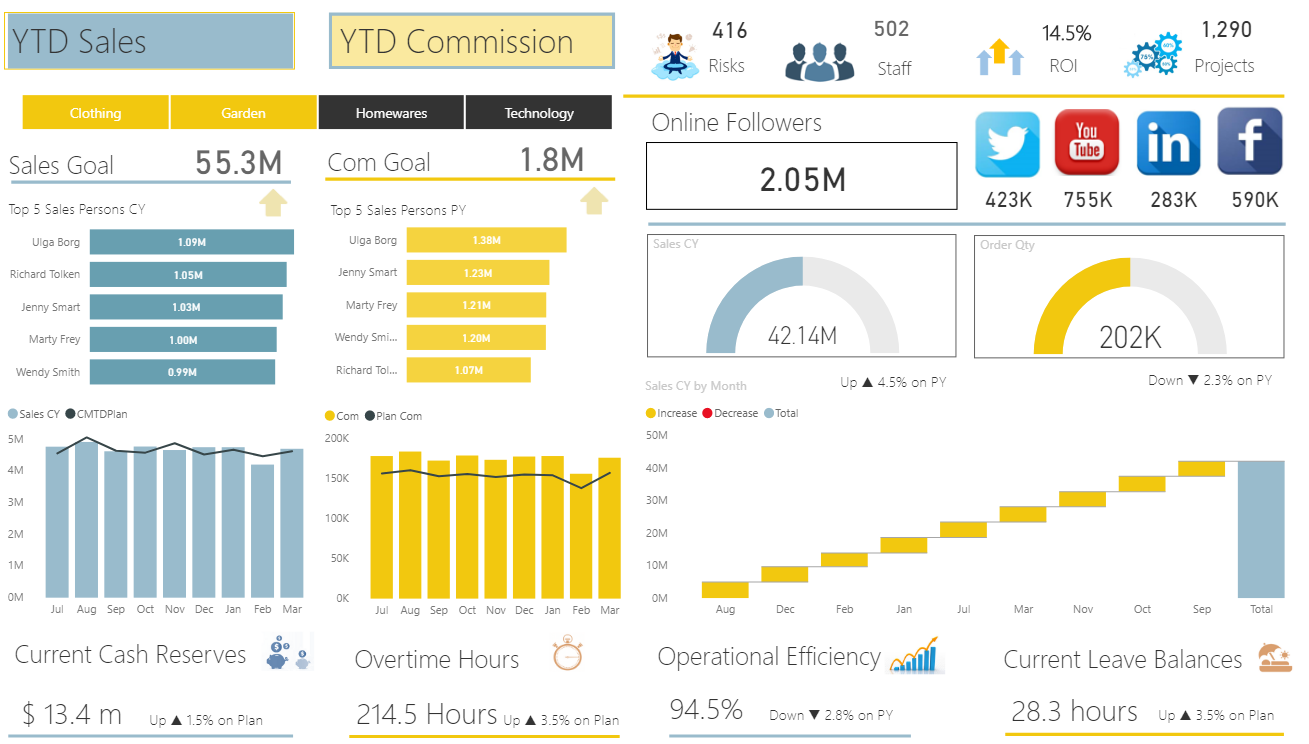
Power BI Dashboard Examples
Anyone attending any of the CPA Australia Power BI courses that I run will know that I place a lot of emphasis on the final product in Power BI. A well designed dashboard simplifies the data and presents it in a logical manner. The dashboard spins by department.
Read More
Excel Dashboard Designs
An Excel dashboard split into three levels the dashboard displays information by state and gives some of the key performance indicators for each of the business areas.
Read More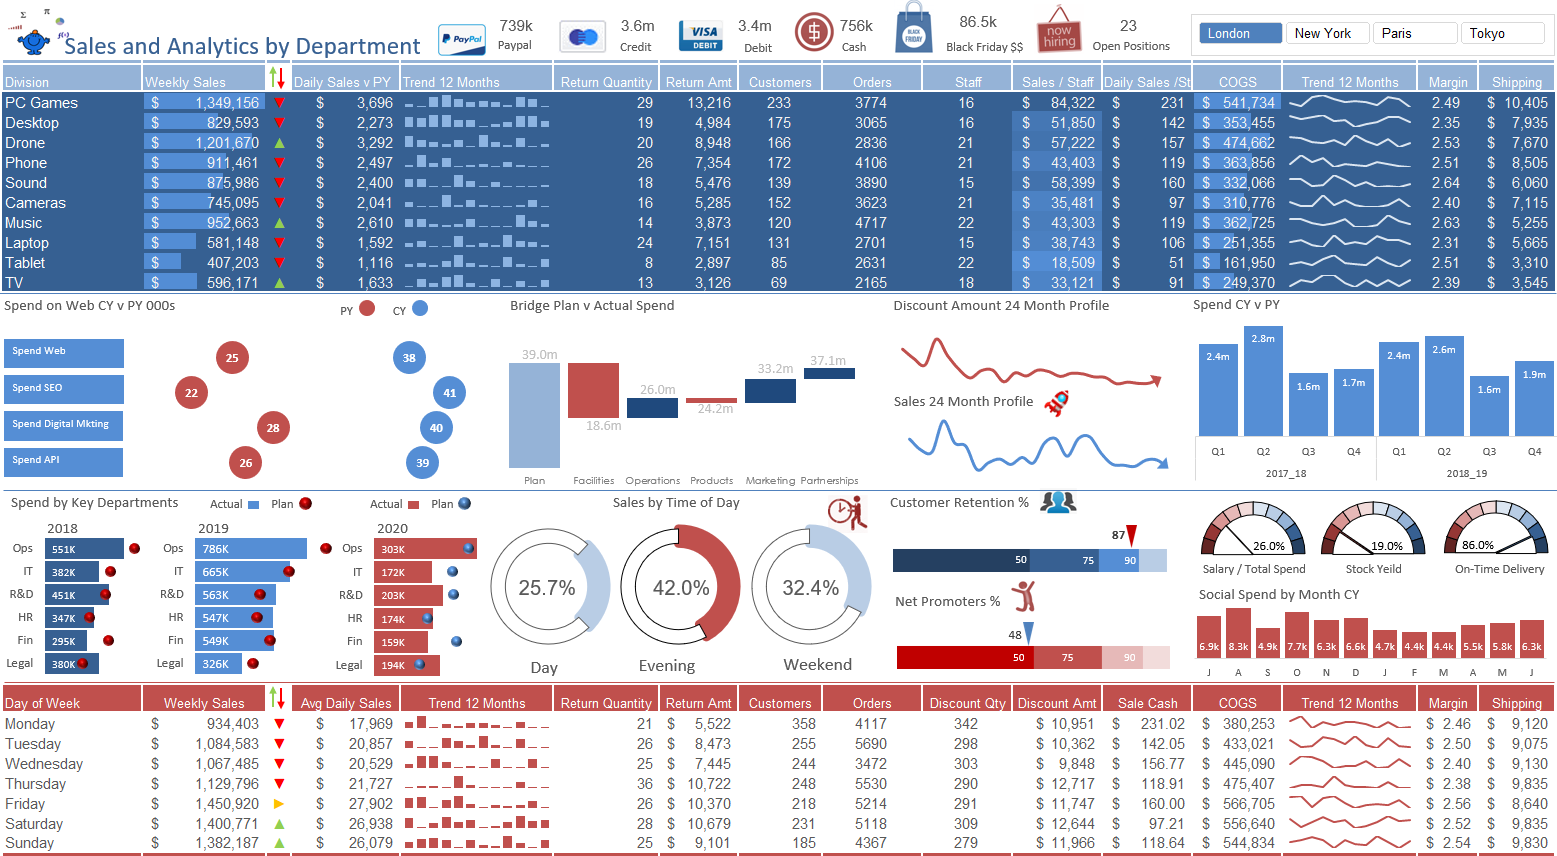
COGS and Sales Dashboard
A COGS and Sales Dashboard made exclusively in Excel. The dashboard is mostly from a single data source and has a slicer to change the region upon clicking everything will change.
Read More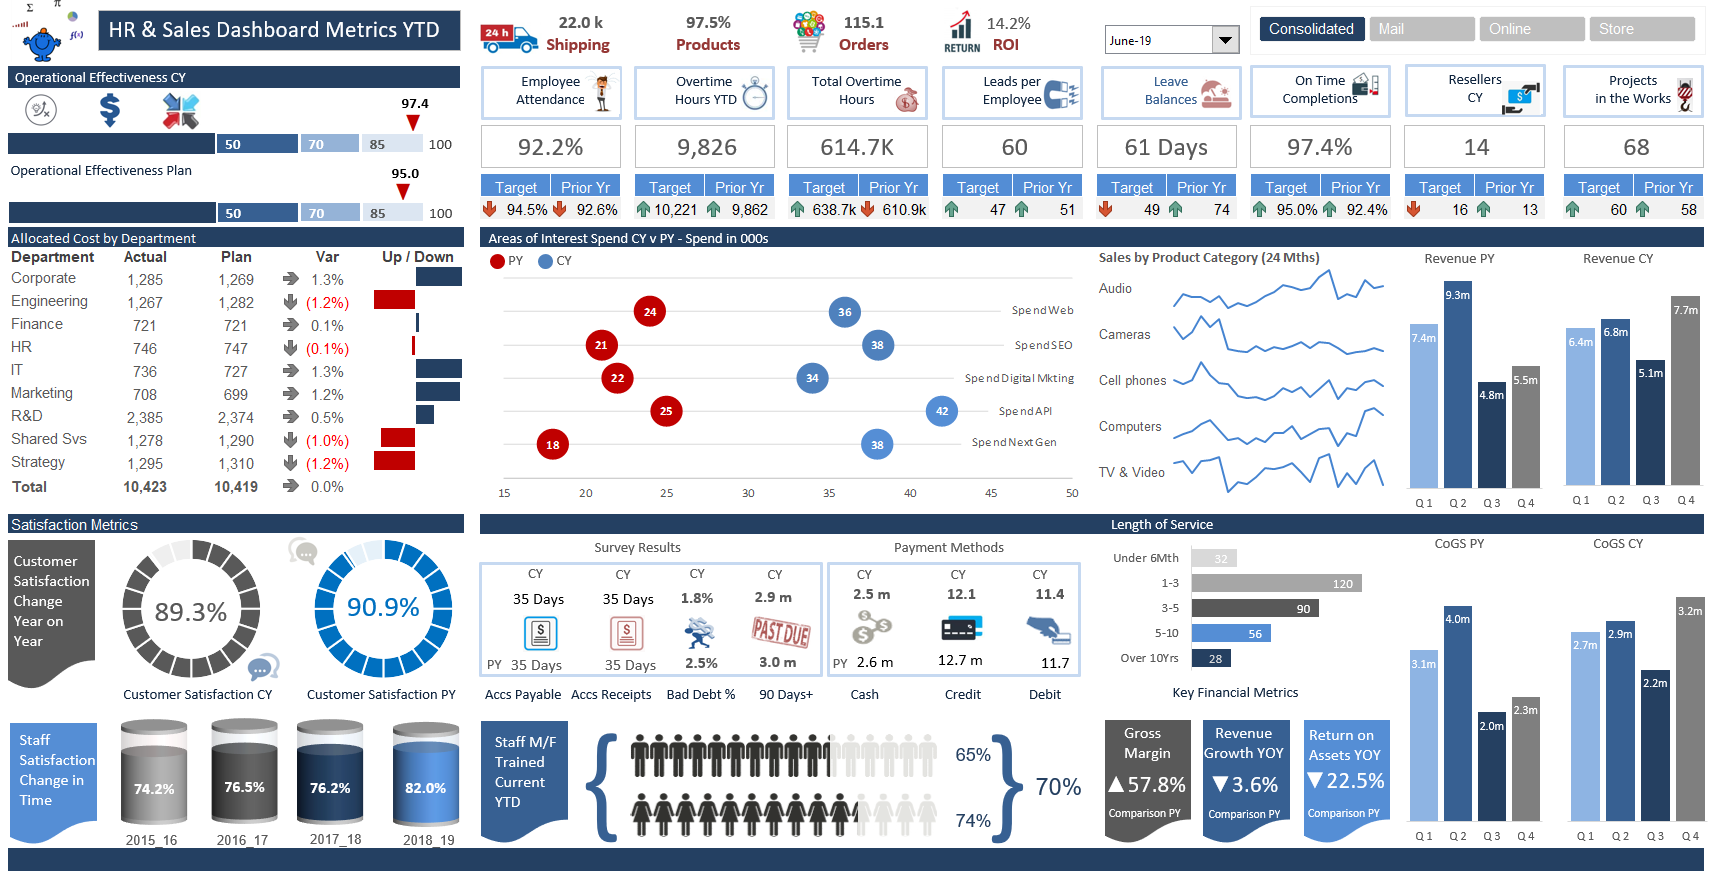
Excel Dashboard Reports and Courses
Excel Dashboards can make life a lot easier when they are ready made. Take the design and structural setup out of the dashboard process and purchase these premium Excel Dashboards.
Read More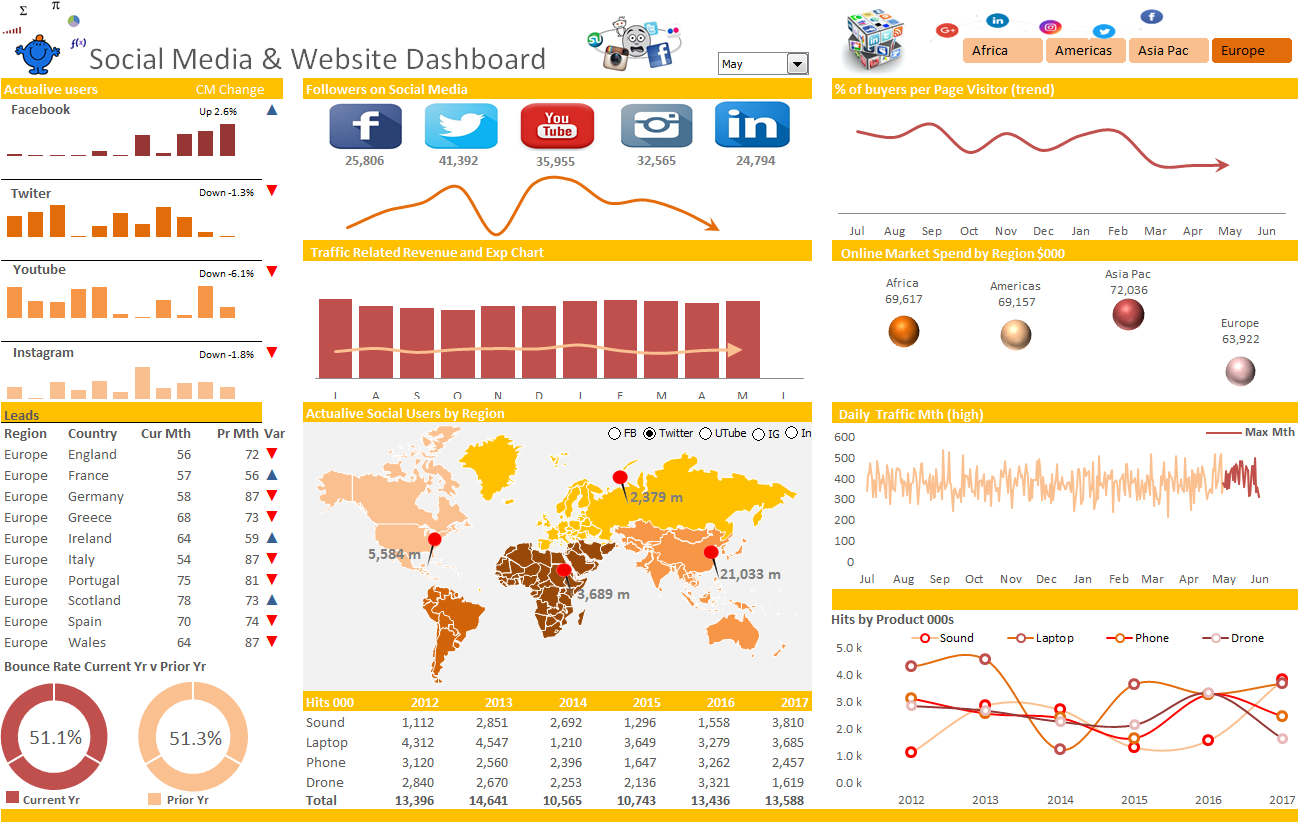
Social Media Dashboard in Excel
This is a social media dashboard created in Excel. It is free to download and has all of the graphs and source formula in the file.
Read More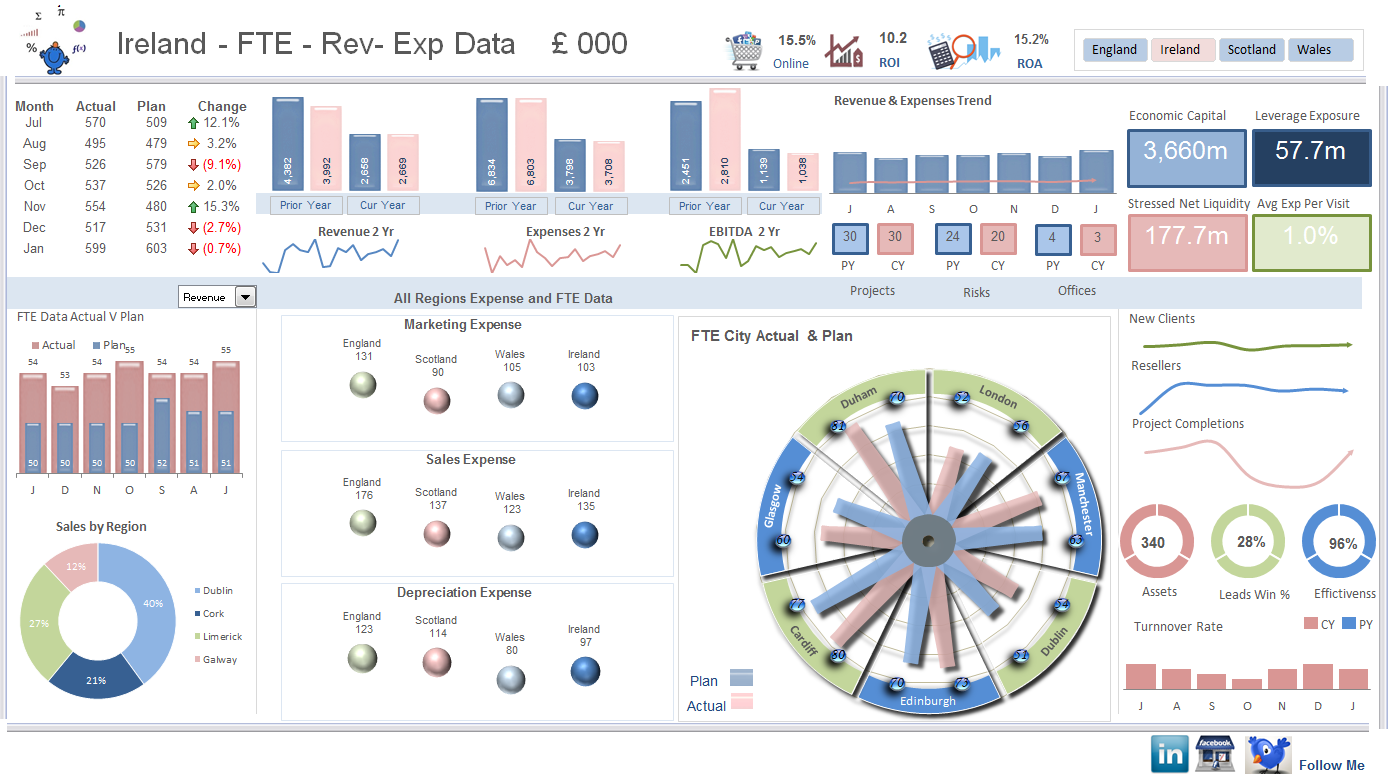
More Dashboard Updates
This is a post about updates to the Excel Dashboard section of the smallman site.
Read More
Excel Dashboards Essential Updates
This Excel dashboard displays revenue and expense metrics with some additional KPI data.
Read More
Social Media Dashboard in Excel
A social media Dashboard. It outlines social media activity, visits to pages, likes, retweets. The dashboard focuses mainly on Pinterest, Facebook, Twitter and Google +.
Read More
Incident Tracking Dashboard
The dashboard tracks incidents by year and by cost. It is only a small dashboard but has stacks of functionality.
Read More

Road Traffic Statistics in Excel
While going through some road traffic information on the Department of Transport's website it occurred to me that the data was perfect to create a dashboard. It was information rich and there were very little gaps in the data. I decided to use quite a few pictures in conjunction with the charts to try and spice them up. I have used actual data but had to ‘normalise’ some of the data as there were a few gaps.
Read MoreFeatured Posts

Recent Posts

Inflation Over Multiple Years in a Single Cell January 10, 2025

Hubspot Dashboard October 3, 2024
Monthly Dashboard With Supporting Metrics September 25, 2024

Excel Show Missing Sheet Tabs July 29, 2024

Run Macro Overnight Automatically June 24, 2024

Split File into Parts and Save to Directory April 20, 2024
Most Popular Author December 14, 2023
Creating an Excel Dashboard - A Guide with Templates December 8, 2023
Real Estate Excel Dashboard October 11, 2023

Updating Excel Dashboards September 29, 2023