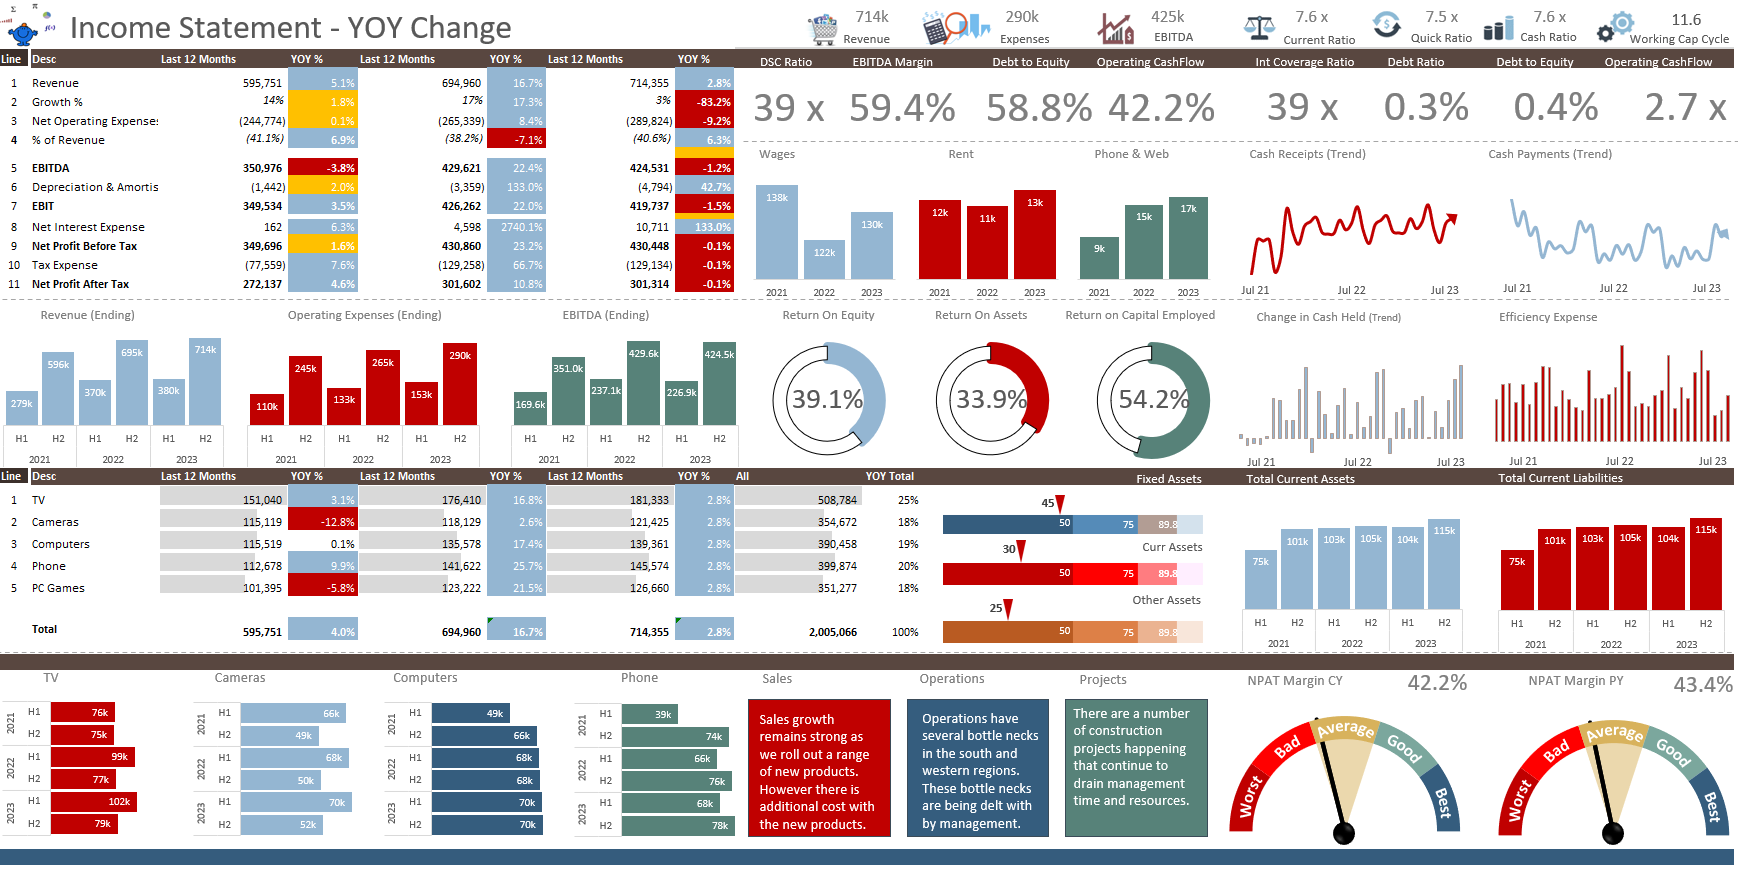
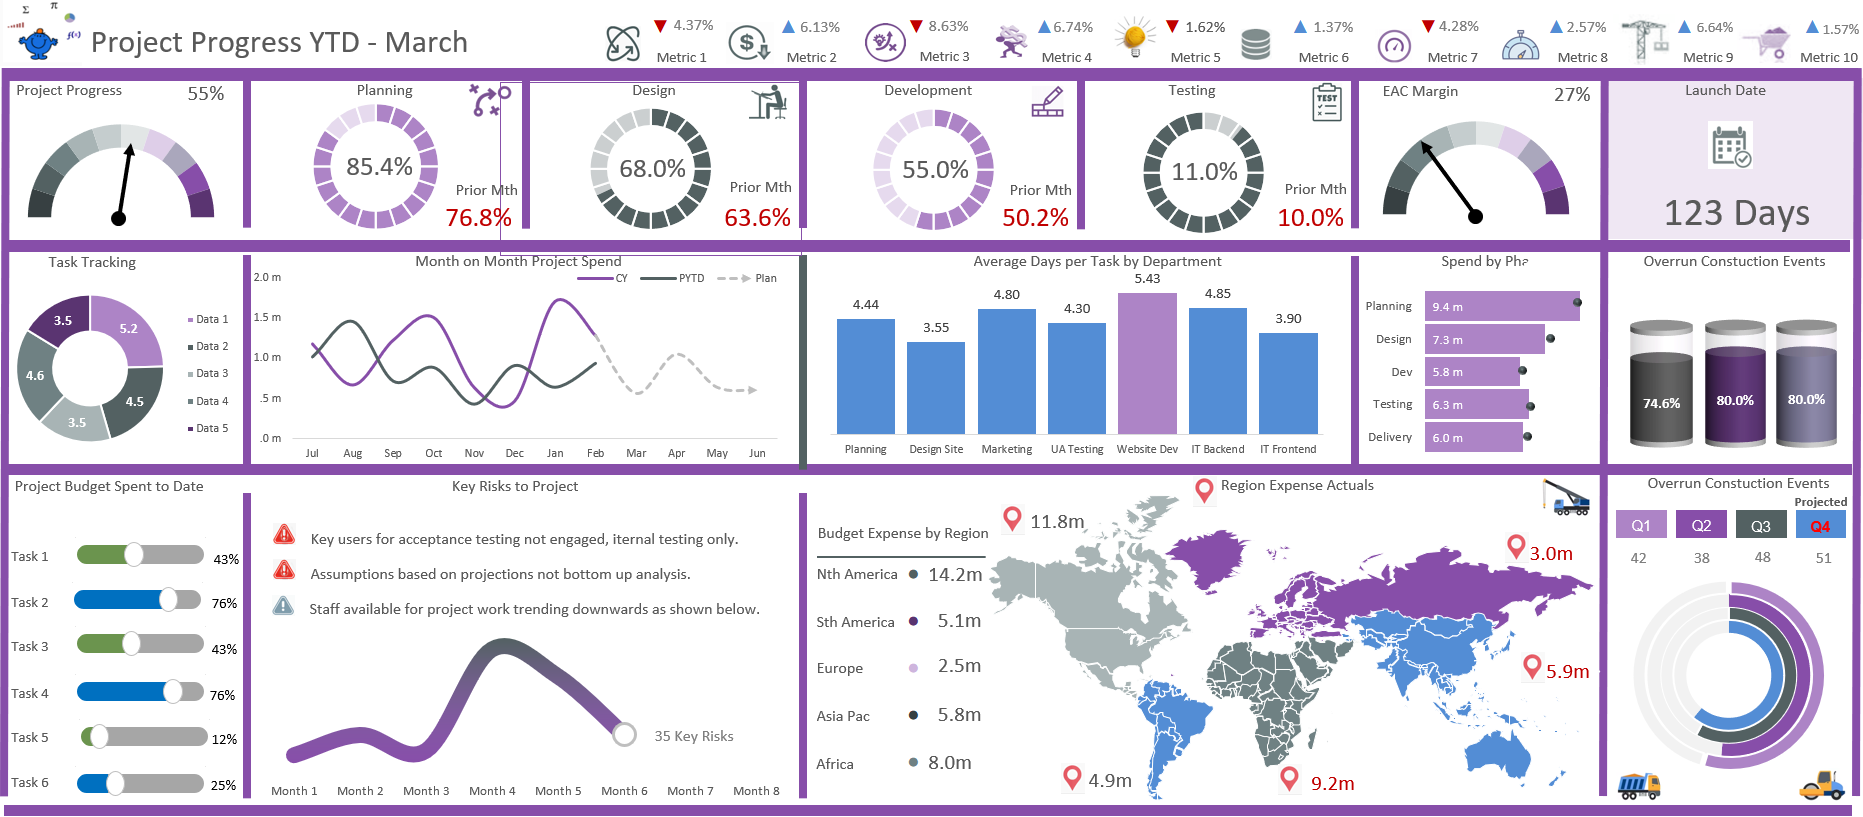
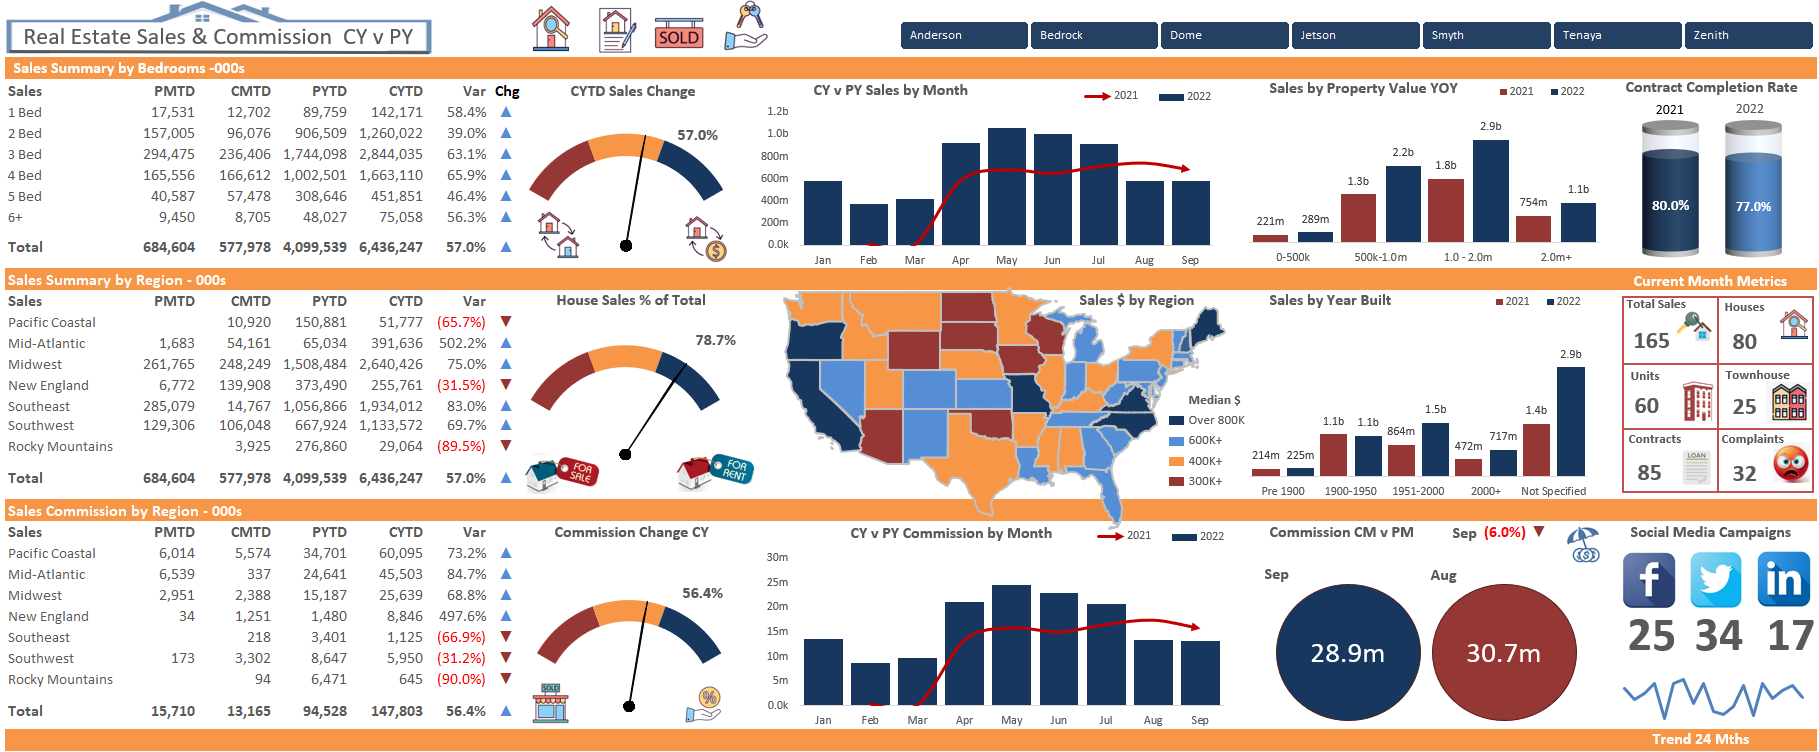
I wanted to create a dashboard which was predominantly fed from a single data source. Most of the data in the following dashboard comes from a single table of data. It is amazing how much you can glean from a single data source. I was playing around with a file I had and started arranging the data in columns and it started to take shape. I added some charts for my client (changed the source data) and kaboom, completed dashboard with all the bells and whistles. It is very satisfying finishing a dashboard in Excel. Click the dashboard to see a larger version.
I am not sure how i will use this dashboard but probably be the focus of a half of full dashboard course. I have to put the documentation together which will take some days to produce. In the mean time enjoy the view.
You can find this model on Eloquens. It is an amazing market place with so many models to choose from. I oscillate between the number 1 and Number 3 top authors on the site and there are hundreds of authors there.


