

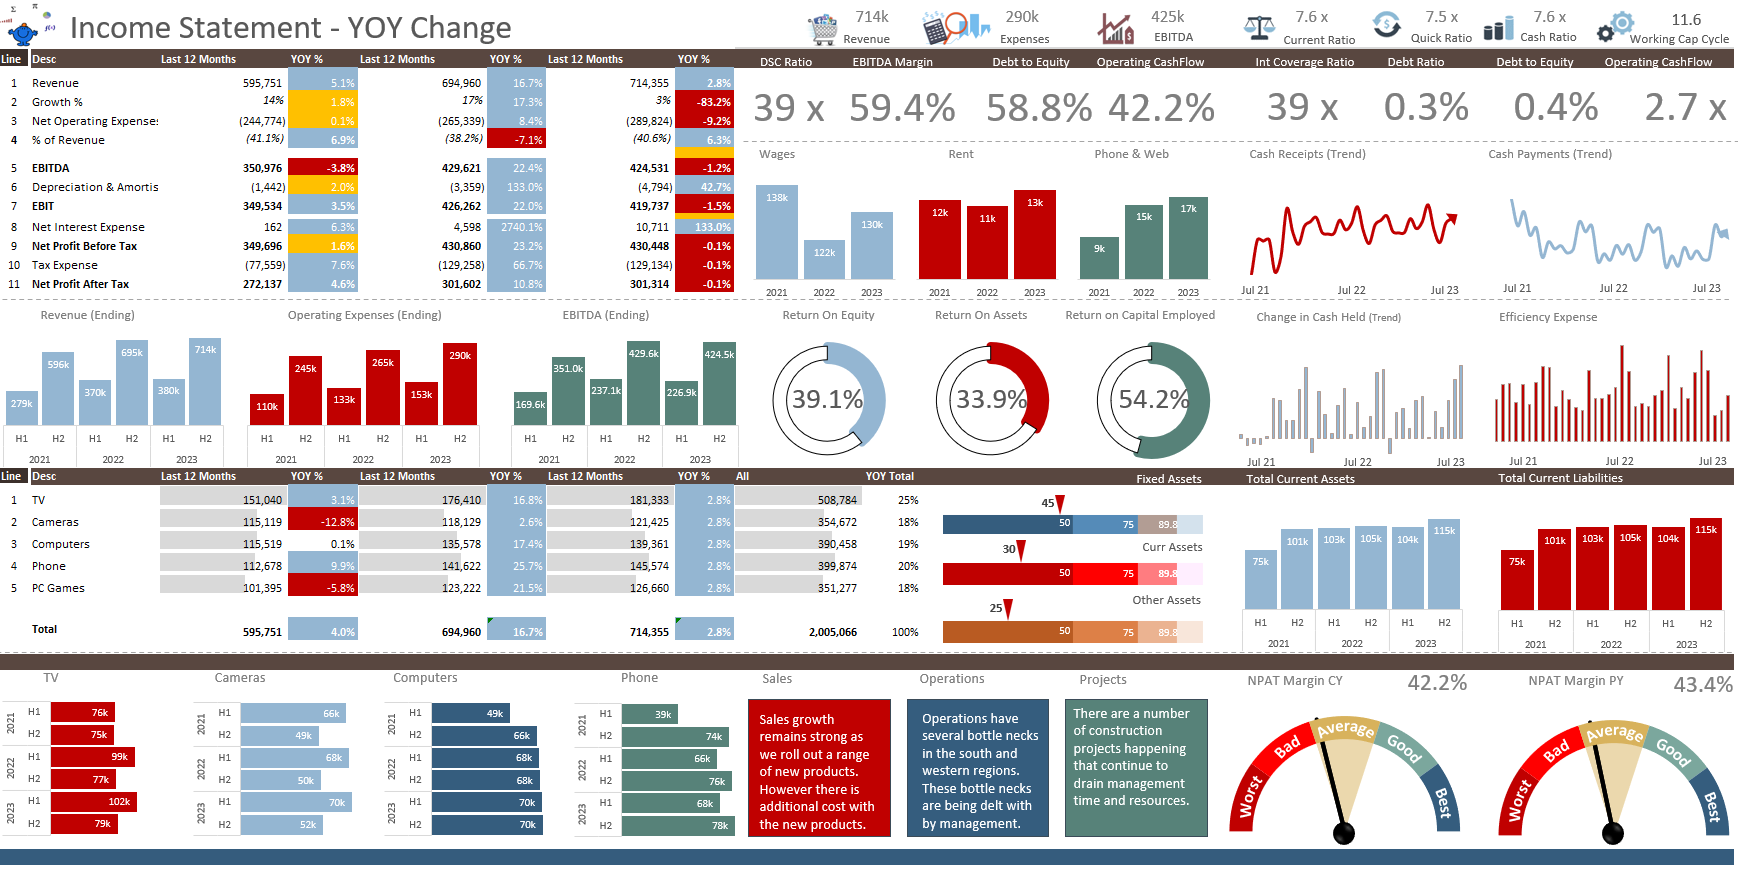
Excel Dashboard Charting with Shapes
An Excel dashboard created using excel charts in the form of shapes. It compares data from prior periods with actual data in a beautiful final output.
Read More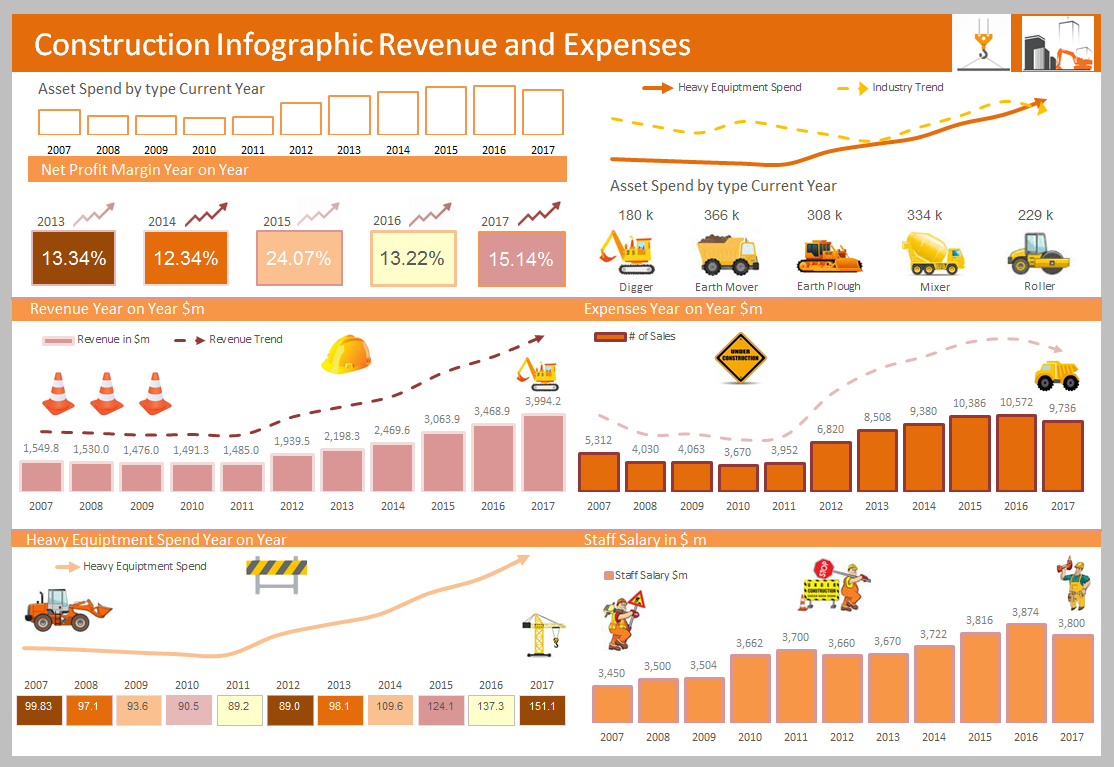
Construction Industry Infographic
This is an Excel infographic covering he construction industry. It displays revenue and expenses with some relevant pictures and charts. You should be able to modify it to your industry.
Read MoreFeatured Posts

Recent Posts

Inflation Over Multiple Years in a Single Cell January 10, 2025

Hubspot Dashboard October 3, 2024

Monthly Dashboard With Supporting Metrics September 25, 2024

Excel Show Missing Sheet Tabs July 29, 2024

Run Macro Overnight Automatically June 24, 2024

Split File into Parts and Save to Directory April 20, 2024
Most Popular Author December 14, 2023
Creating an Excel Dashboard - A Guide with Templates December 8, 2023
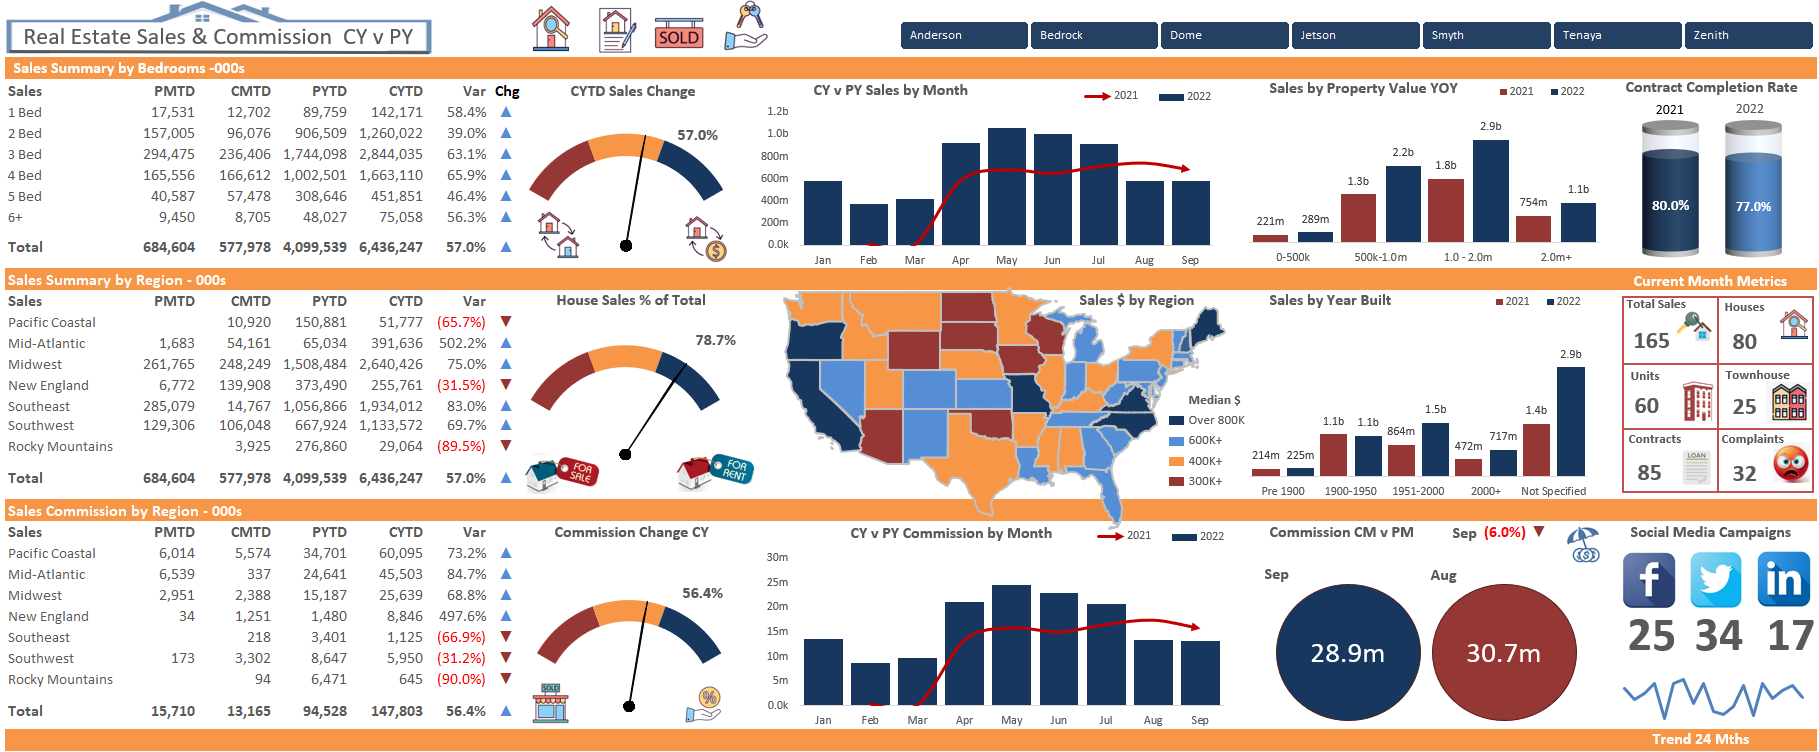
Real Estate Excel Dashboard October 11, 2023

Updating Excel Dashboards September 29, 2023