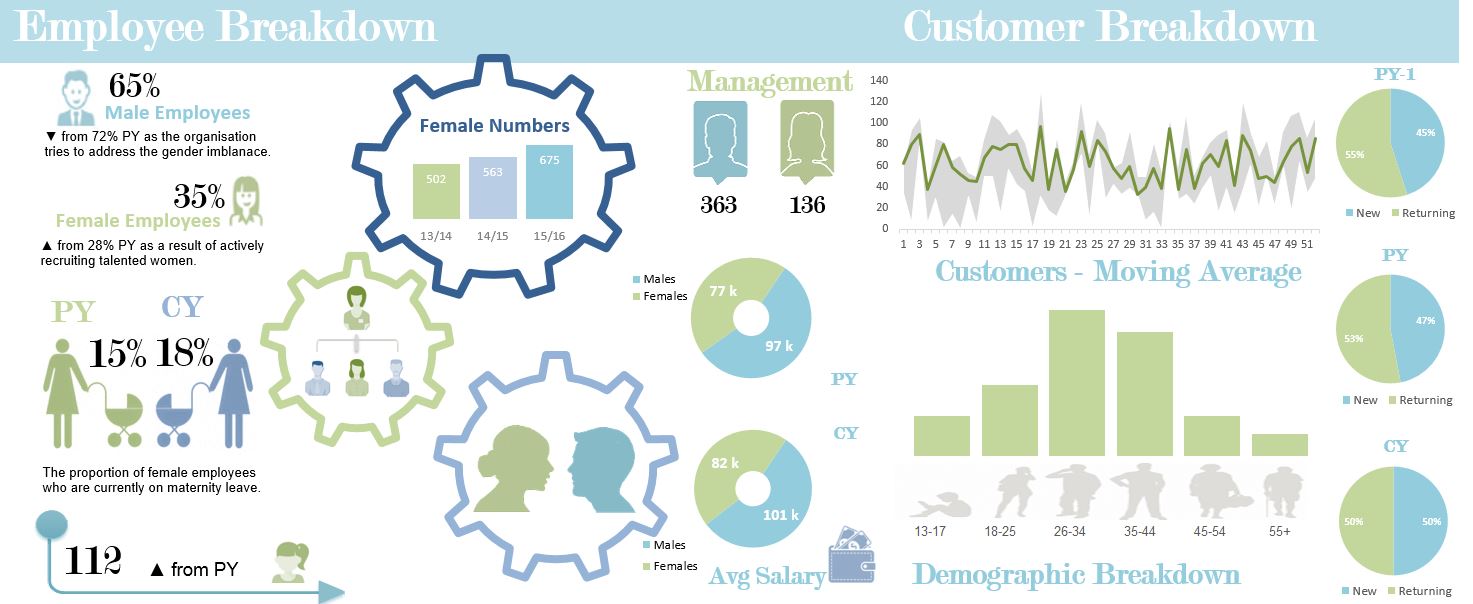
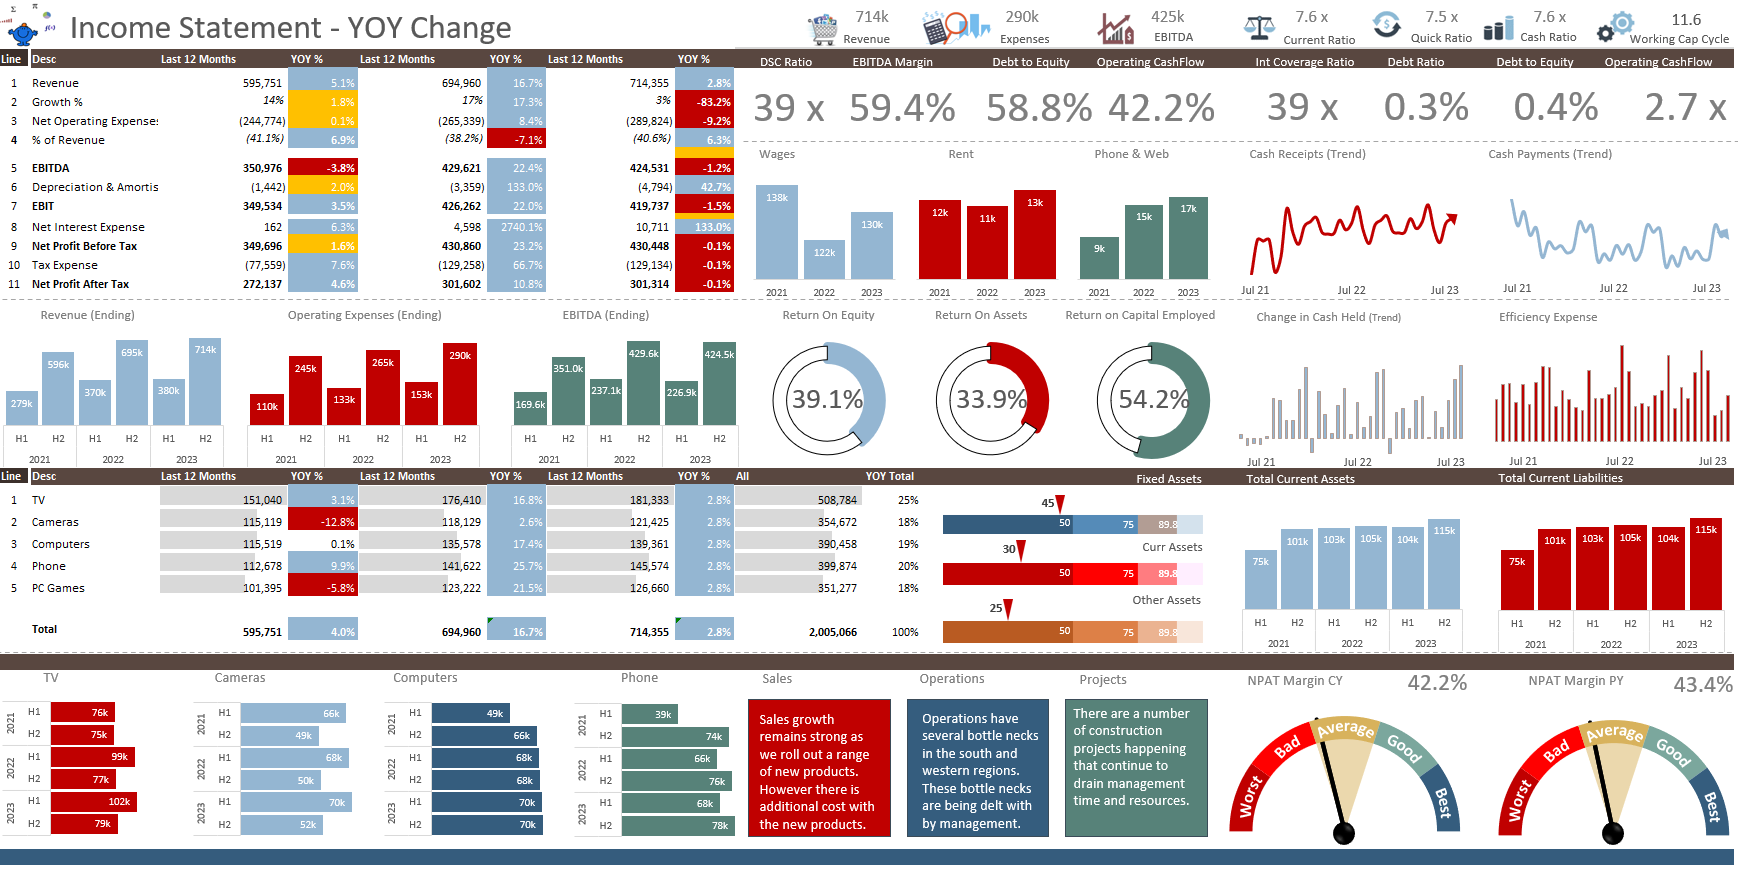
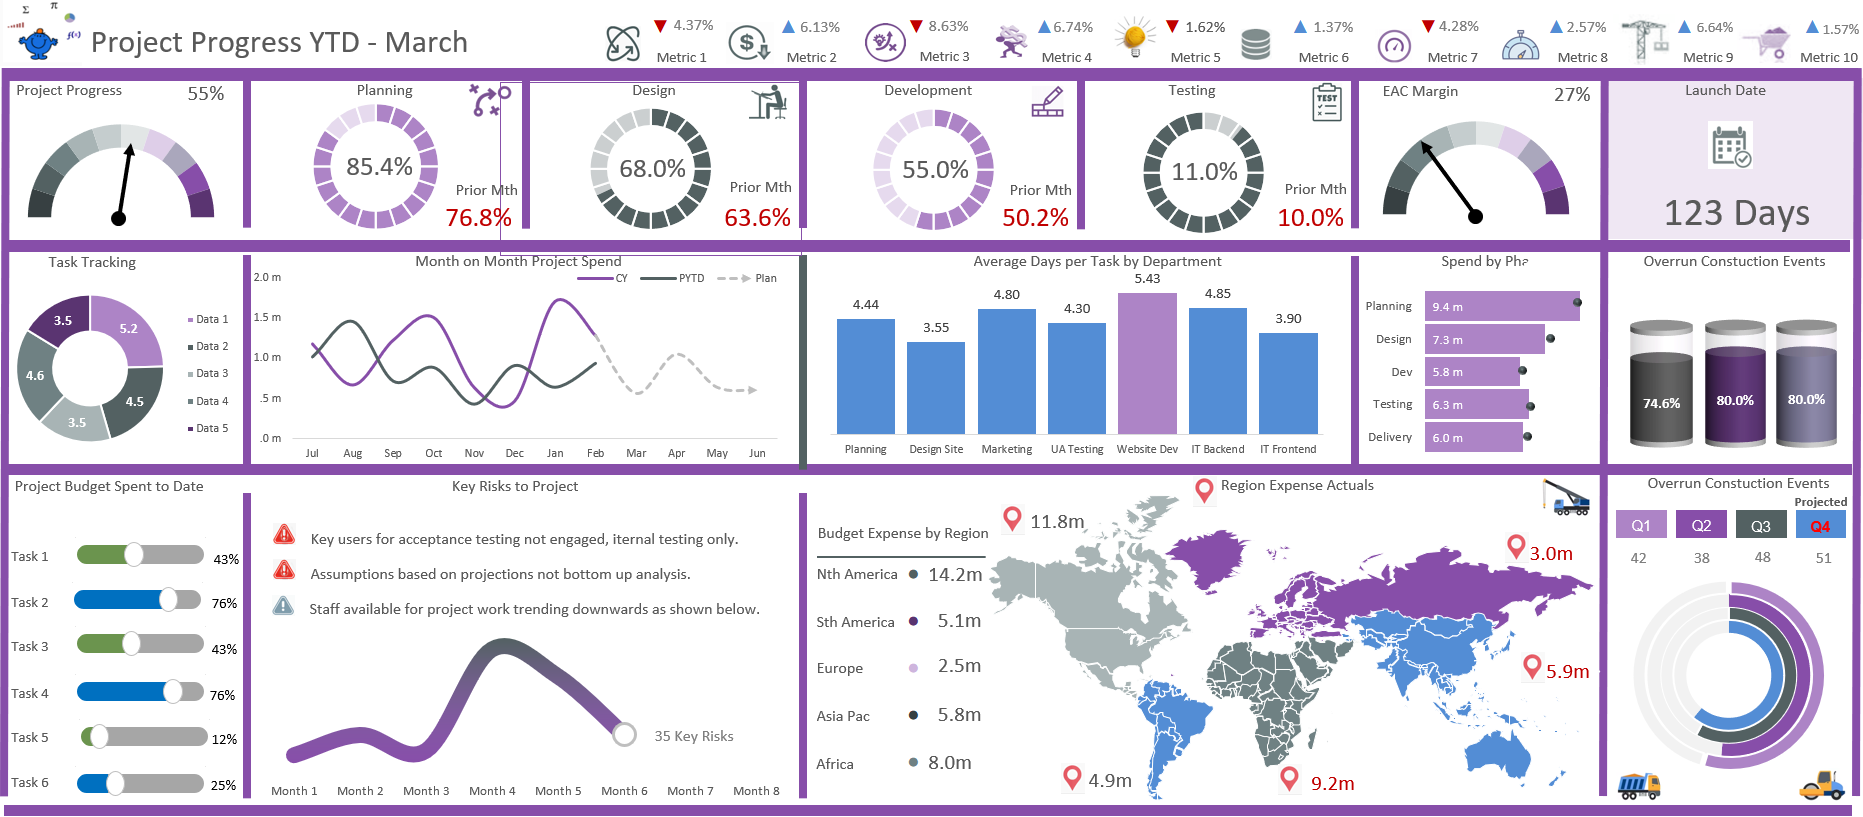
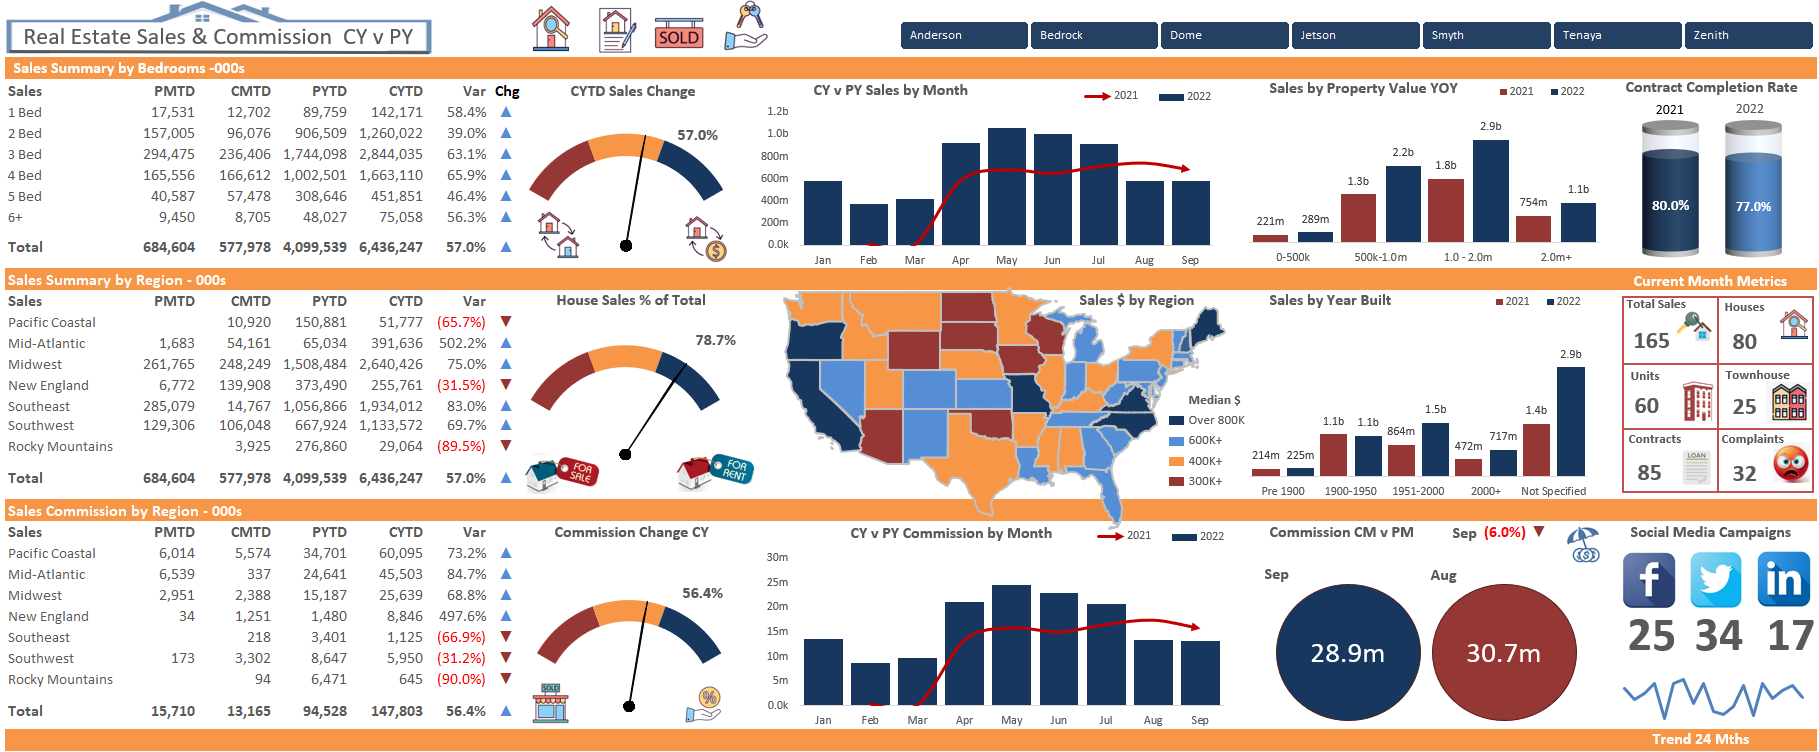
So I am on the infographic trail again. I have been doing a 3 part series for CPA Australia and have decided to make a few additional Excel infographics just for a bit of fun on the side. With all of the inforgarphics on the site I have not built complex calculation engines. I simply put a visual display together which is driven by the contents of Excel cells. The result is an easy to maintain and update visual report. With any luck some people might find the results useful in the work they do.
The Excel file which makes up this infographic is attached below. Enjoy!!!


