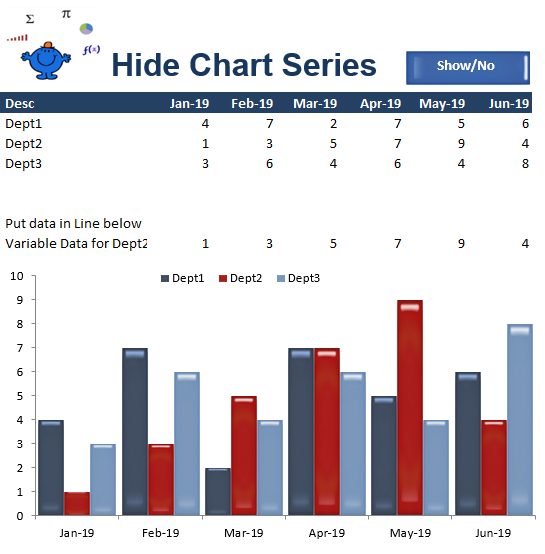
Remove a Chart Series
There are times when you may wish to exclude certain information from a graph. There are several ways to not show data and the following will outline a couple of methods. Excel will not chart data which displays NA values. It will not display data which is not visible - either grouped or hidden rows within a spreadsheet. You can use these two methods to take information out of graphical displays at your discretion.
Once the button is clicked the following is all which appears.

The code which sits behind the button above is only for demonstration purposes as it automatically puts data in the table or strips it out. Some may be interested in the coding and here it is.
Sub ClearCht() 'Excel VBA to strip data from table.
Or name a range for the chart series range values and the code will become.
Sub ClearCht1() 'Excel VBA to strip data from table.
There is a more elegant way to not display the data. Excel will not display data in a graph which is hidden. So if you group the data you don't wish to show you can add the data in or take it out of the graph by clicking on the grouping button.
The file displays this method as well.