Update Chart Series with VBA
The following Excel chart performs the same function as the Dynamic updating Chart where you choose how many periods the series will show. This chart performs the action when Cell A11 changes. The yellow cell below is the trigger and when the number in this cell changes Excel with the help of VBA will alter the chart series to accommodate the number placed in A11. A word of warning, obviously you can't put a number which is greater than the series which are in your source data.
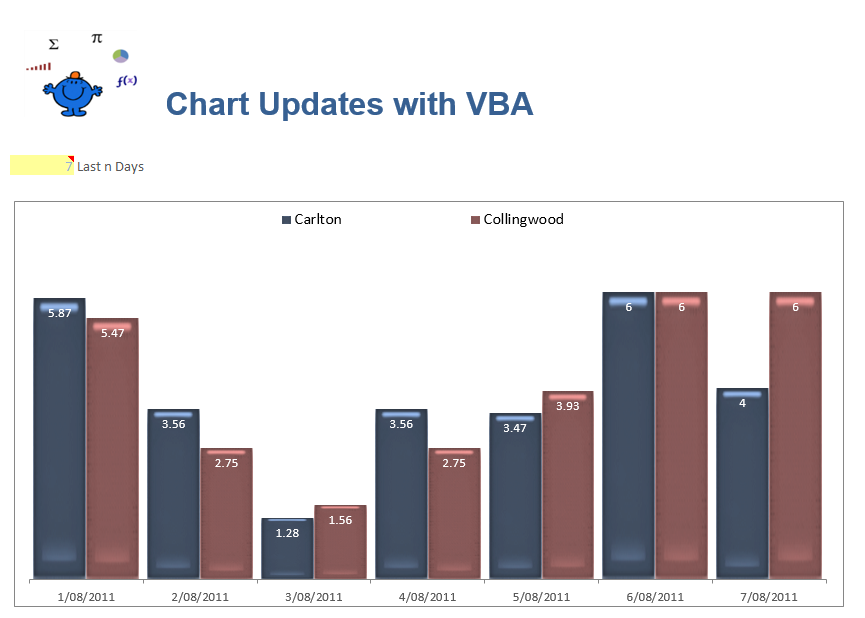
The above screen shot shows 7 Days, see Chart Last n Days on the left of screen. By changing the number in the cell from 7 to say 15 the chart will update to show 15 days. It provides a bit of flexibility for presentations where you may want to show more or less information upon request. With the following procedure the button has been made redundant. When a fresh figure is put in the Cell the chart will update.
The first thing to do is to create a change event based on the cell with the number of series to add. This should go in the Worksheet object where the cell to change is located. In the attached example the cell which identifies each series is contained in the ChartVBA worksheet.
In the VBE editor click on the sheet Object where the cell you want to change is located.
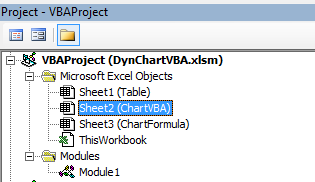
The following Excel VBA procedures placed in the Worksheet Object. So if you plan to run the VBA procedure from Sheet1 then this coding goes in the Sheet1 worksheet object.
Private Sub Worksheet_Change(ByVal Target As Range) 'Excel VBA to trap change to cell B10.
The UpdateChart process which goes in a regular module is as follows;
Sub UpdateChart() 'Excel VBA procedure to update the chart.
Dim i As Integer
Dim lw As Long
Dim lr As Long
Dim sh As Worksheet
Dim ws As Worksheet
Set sh=Sheet1 'Table
Set ws=Sheet2 'Chart
lw=sh.Range("A" & Rows.Count).End(xlUp).Row
lr=lw + 1 - Range("n") 'Cell where days is stored.
ws.ChartObjects("Chart 1").Activate
ActiveChart.ChartArea.Select
ActiveChart.SetSourceData sh.Range(sh.Range("B" & lr & ":C" & lr), sh.Range("B" & lw & ":C" & lw)), xlColumns
End Sub
The Excel file attached has two chart sheets. One using a formula to update the chart and the other using the above VBA procedure. To see how the dynamic formula was created see the article on Dynamic Updating Charts. I have shown both examples side by side to ghow how both Excel methods might work.