Toggle Series within a Chart
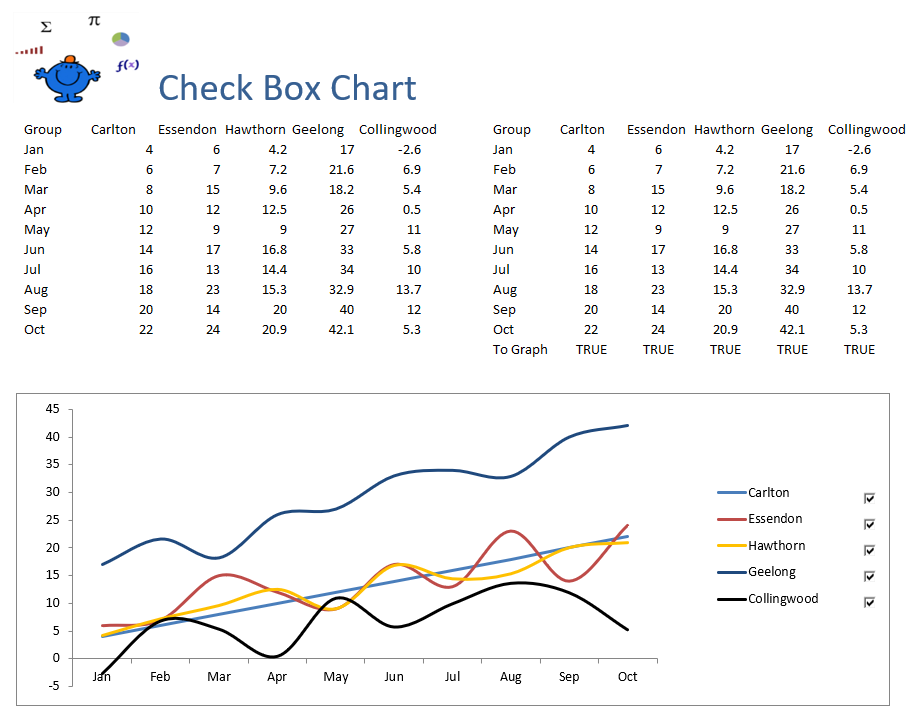
Creating Charts with series which can be brought in and taken out with the click of a button is possible and creates a nice interactive chart. This can be done with or without VBA and the following example will focus on the use of a userform and VBA to achieve a toggle Chart. The following image is the final output where you can click on any of the series to have it either included or excluded.
The following is the code which goes with the creation of a model of this nature.
Sub ChartContent() 'Excel VBA process to select the chart and show the userform.
ActiveSheet.ChartObjects.Select
The above will select the chart and the ufChart is the name of the Userform. Using meaningful names to describe objects can be useful for larger projects when you have multiple objects in the file.
VBA for the Userform
The following procedure will trap the selections of the userform. When you can choose which series you want shown in the chart, the process will assign those series to the chart.
Private Sub UserForm_Initialize() 'Excel VBA procedure to initilise the userform. Dim iSres As Integer
With ActiveChart
ListBox1.Selected(ListBox1.ListCount - 1)=Not (.SeriesCollection(iSres).Border.LineStyle=xlNone)
End Sub
Private Sub cmdApply_Click() 'Excel VBA process for the OK button.
Application.ScreenUpdating=False
With ActiveChart
.HasLegend=True
For iSres=.SeriesCollection.Count To 1 Step -1
.SeriesCollection(iSres).MarkerStyle=xlAutomatic
.SeriesCollection(iSres).MarkerStyle=xlNone
.Legend.LegendEntries(iSres).Delete
Unload Me 'Hides the userform.
The following Excel VBA procedure is attached to the Cancel button of the User form. It simply closes the user form if you do not require it.
The attached Excel file outlines the VBA procedure with a practical example.


