Getting Stock Symbol Data in Excel
Excel now has a feature where you can add the stock price into an Excel cell. It is really straight forward all you need are some valid stock ticker symbols and you can bring the current price into your spreadsheet dynamically and the stock data will update. Then you can use an adjacent column to generate other stock price data, like the 52 week high/low or the market volume and so on.
The following video shows you how to set up a stock tracking table and import the data seamlessly. This is the Excel file I used in the video.
The Excel Sheet Setup
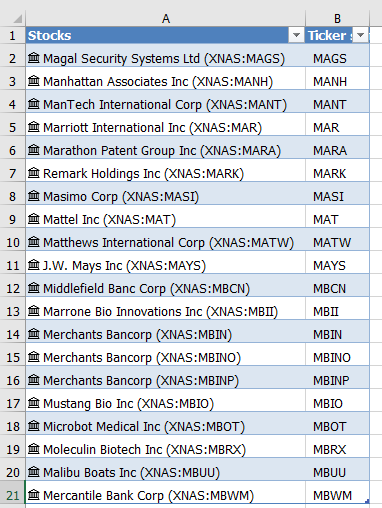
The first thing we need is a list of ticker symbols. Ticker symbols are the stocks name, the short acronym that represents the company, makes it easier for markets to track short symbols rather than largely variable names.
Highlight the above list - then go to the Data menu.
From the menu choose stocks.
Excel turns the ticker symbols into company names. We can easily get the tickers back or any other company information.
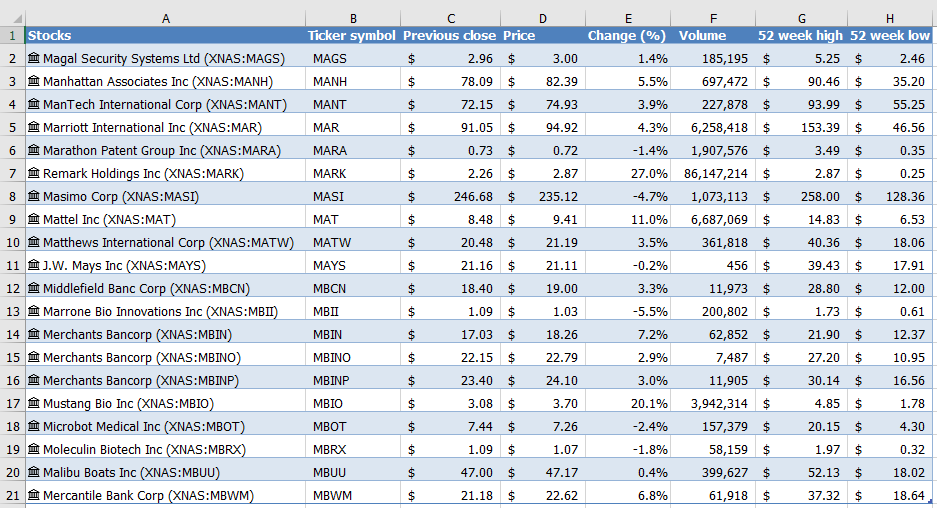
Click on the little square with a plus + symbol at the top. This will give you a list of options. Once you choose your option Excel will go to the web and return the data you request.
The ticker symbol will appear in real time. We can add a great deal more data just by following the same procedures.
The above took under 30 seconds to pull together. The data is refresh-able and the next time you open the file the numbers will have updated to reflect the most recent stock valuation in on the market and now to your file.
The following is the Excel file that was used to generate the above list.


