
Create Start and End for Chart
The following article show you how you might create a chart with a start and end combo box. There is no VBA in the following procedure, just smart use of the NA function and Excel formula. The chart is handy for when you want to choose a starting point, an ending point and have the data points in between charted. The chart uses two combo boxes to set the start and end dates for the chart. The following is a screen shot of the attached file.
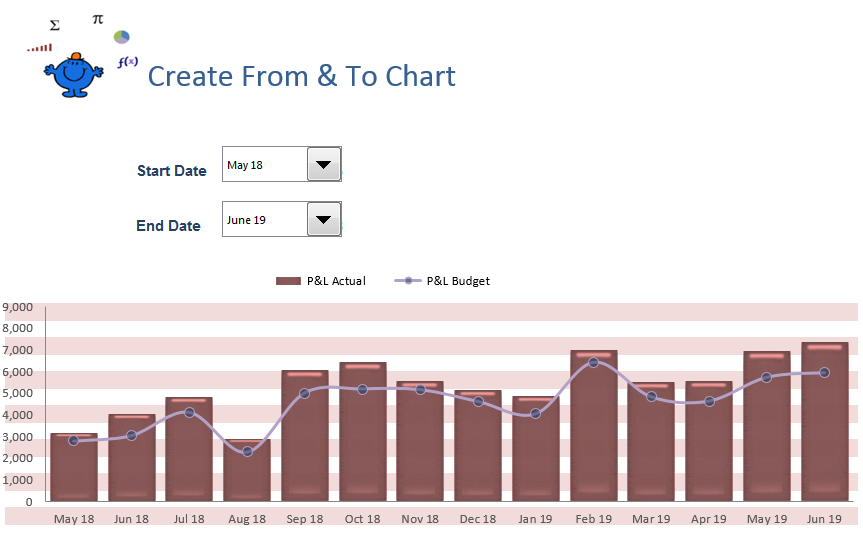
You will notice that the data points between the start and end point are charted. To do this is a small formula which hangs on the charts X axis. The following is the Excel formula which the charts X axis is attached to;
=IF(AND($A6>=$B$2,$A6<=$B$3),A6,NA())
Where A6 contains the chart data point and B2 and B3 contains the link to the start and end date. The formula will return NA if the date on the line the formula. These NA values will not be charted.

Column F has the above formula. You will notice the result of the formula is NA until Jun12 and this is the data in the first image for the start Date. The file will help add a little more context. If the second combo box is less than the first the chart just plots one data point.
