Prior Year Excel Dashboard
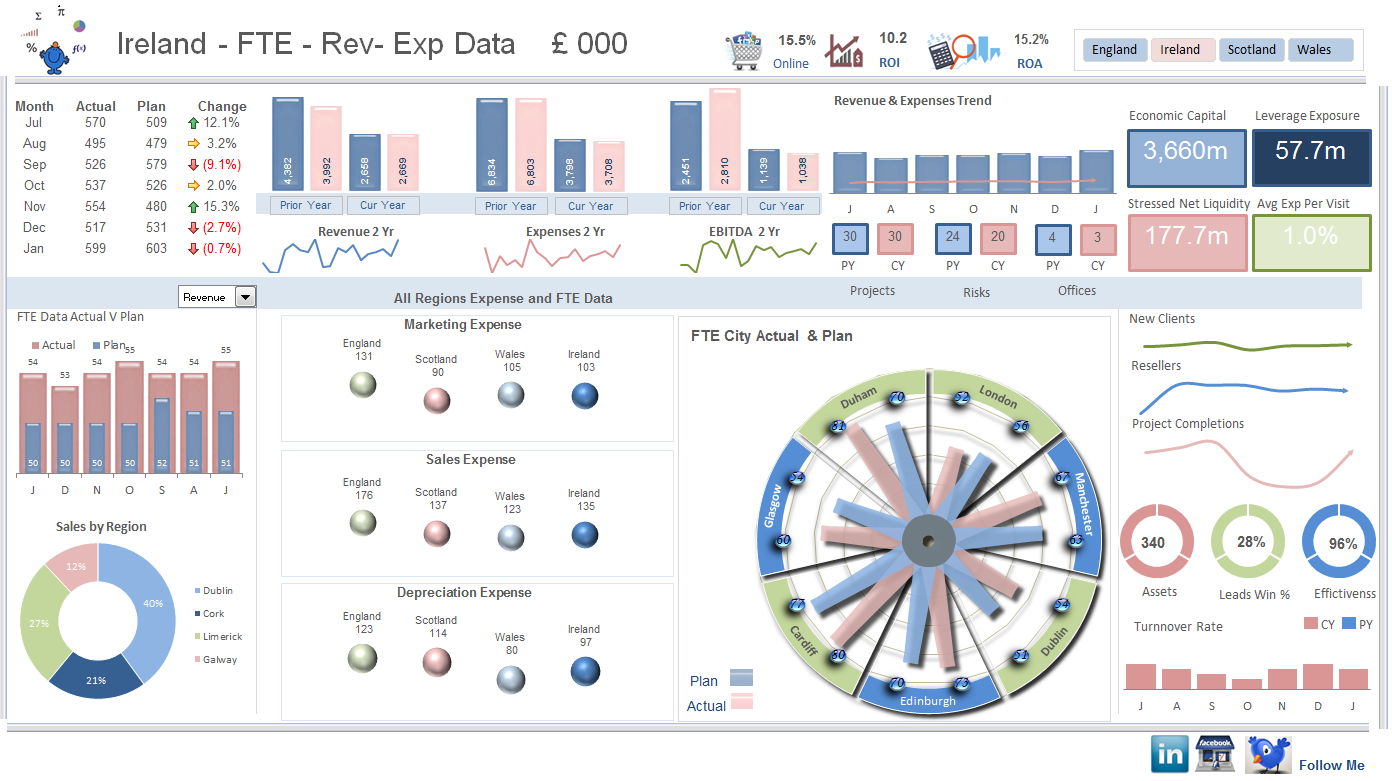
The following Excel dashboard tracks a firms key spending items, plan v actual for EBIT, Revenue and Expenses. I tried adding just two colours to the FTE chart at the bottom right but it did not look so good so I kept the multi coloured look and in this case I think it works in this dashboard. This is highly subjective though and the blue and pink may not be everyone's cup of tea. I do like the simplicity of this Excel dashboard as it is pretty simple to maintain.
For a listing of all Excel Dashboards on the Smallman.com visit this link. There are more Excel files than you will be able to view!! However, the sample should give you insight into what is possible with Excel. Excel dashboard creation should be fun and creative, be consistent with your colours, try to align elements of your dashboard, group like items together to ensure flow and get others involved in the process. Group think always produces a more informed outcome.
This Excel Dashboard does not have any code and has been saved as an Excel 2010 workbook.