Website Analytics Dashboard X
Website Analytics Dashboard X
Website Analytics Dashboard
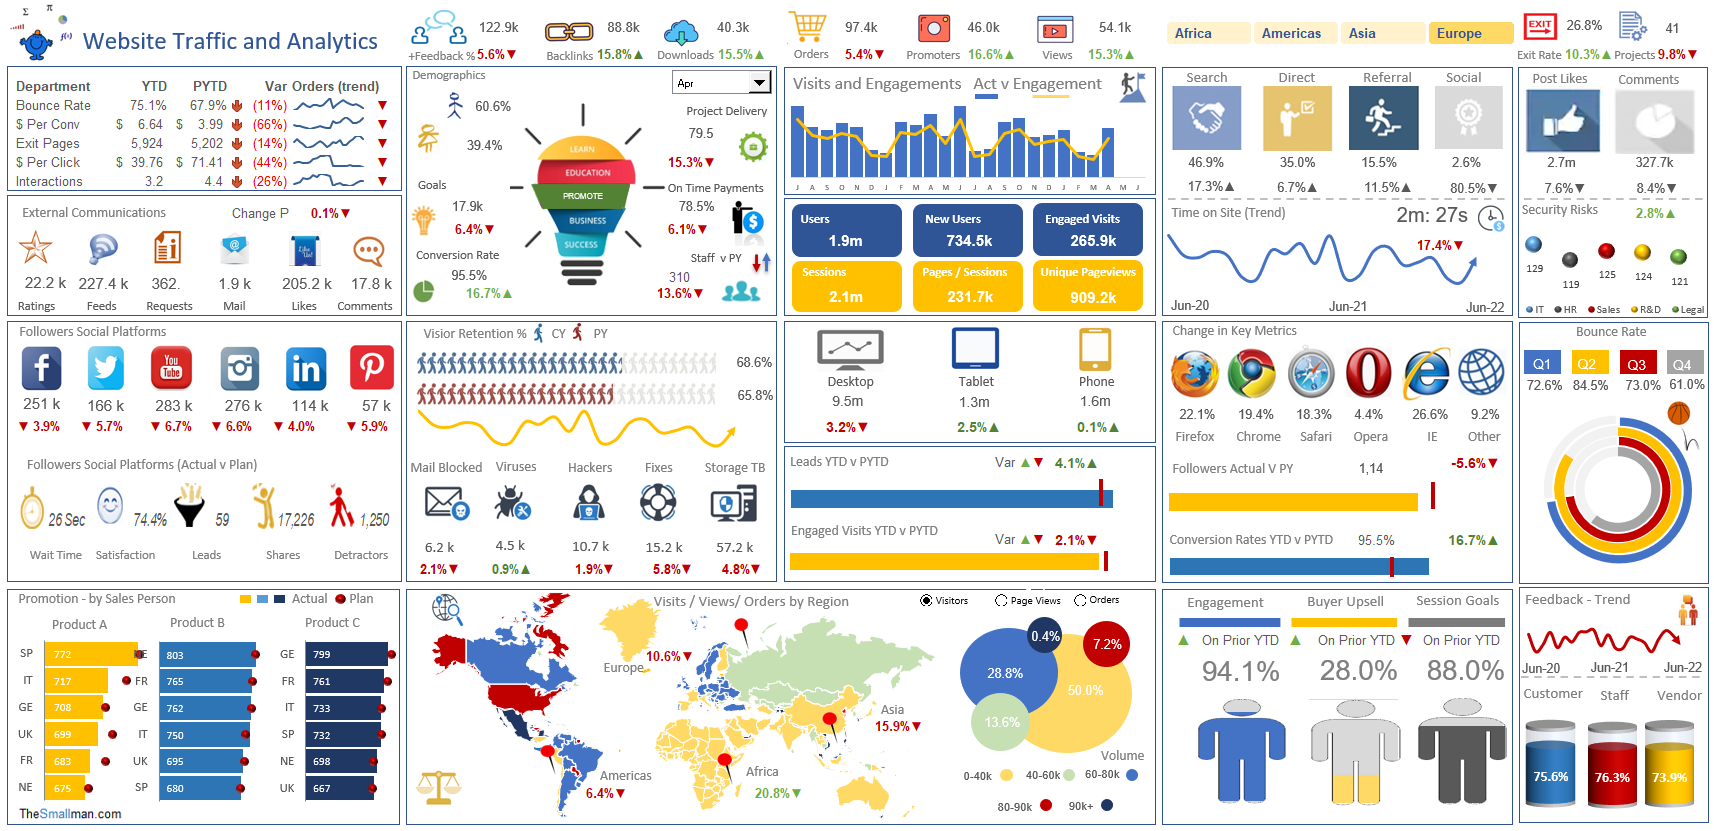
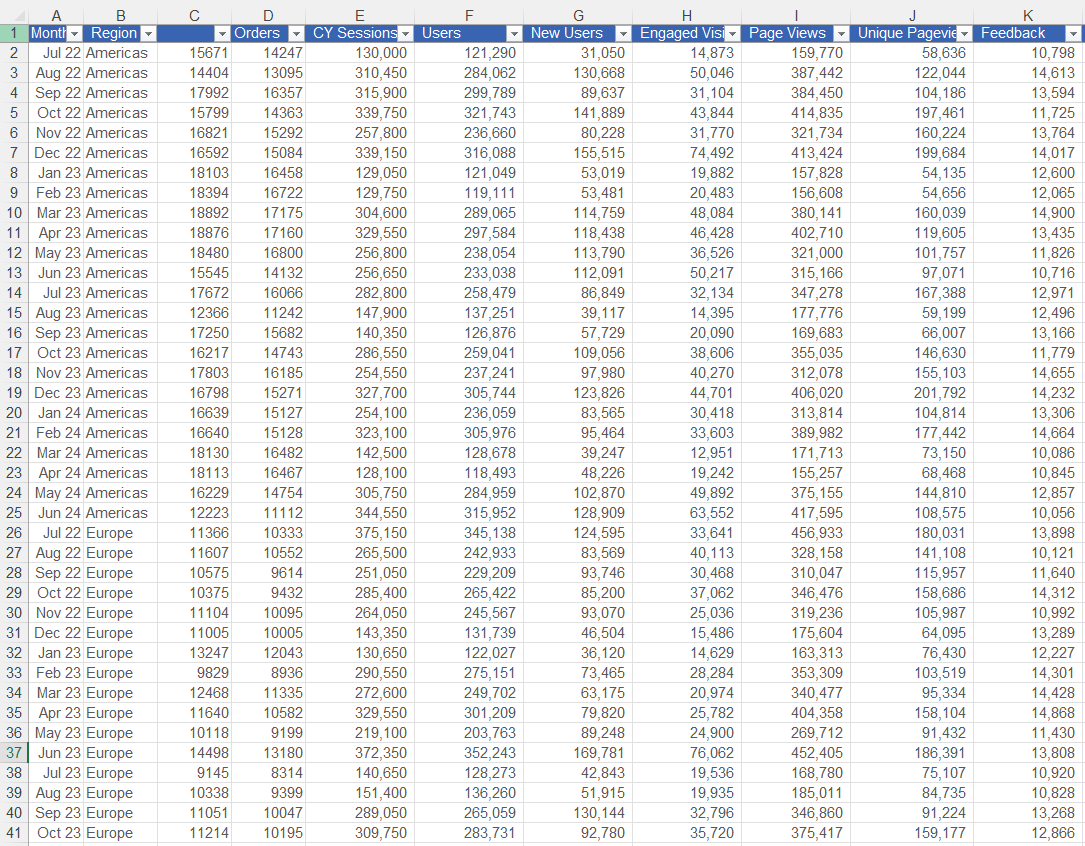
This is a highly detailed web analytics dashboard, for key web and organisational metrics.
Ready-to-use and instantly downloadable, this tool is excellently presented, whilst being clear and easy for the user to manipulate.
This web dashboard is an important resource for professionals to monitor and track the strengths and weaknesses of specific department areas, in order to increase performance. Within this tool are a number of key metrics, these include:
- Revenue and Expense, Gross Profit trending charts.
- Actual v Plan revenue and expense by channel and geographic region.
- Length of service by Year (banded).
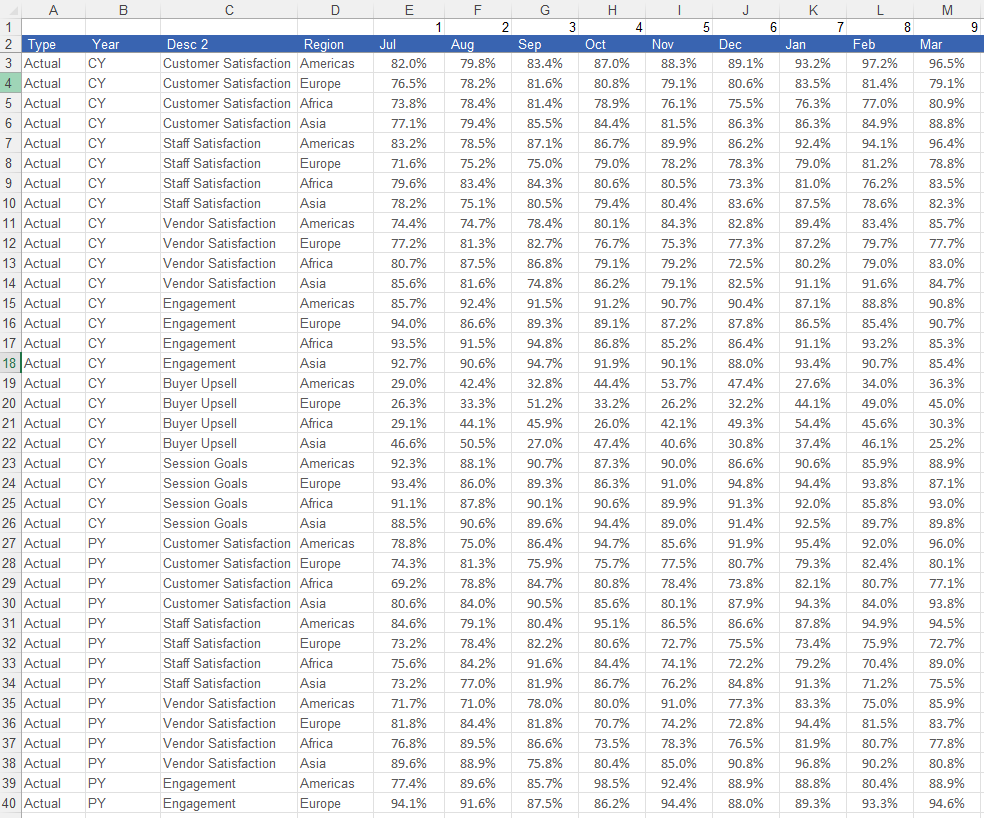
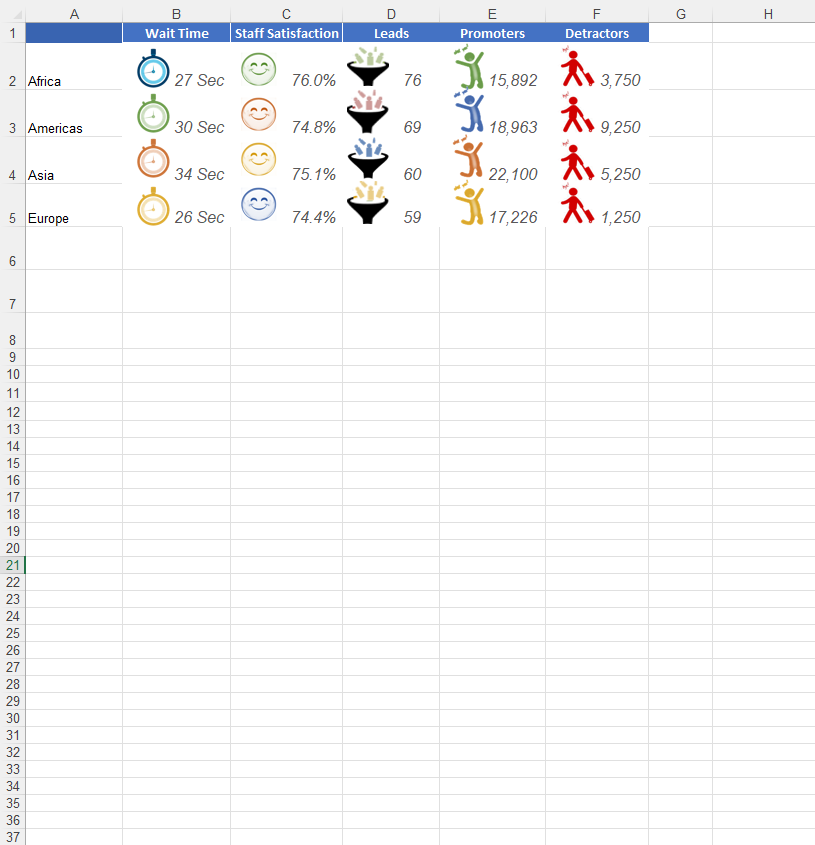
- Satisfaction metrics, including customer satisfaction change year on year and staff satisfaction change in time.
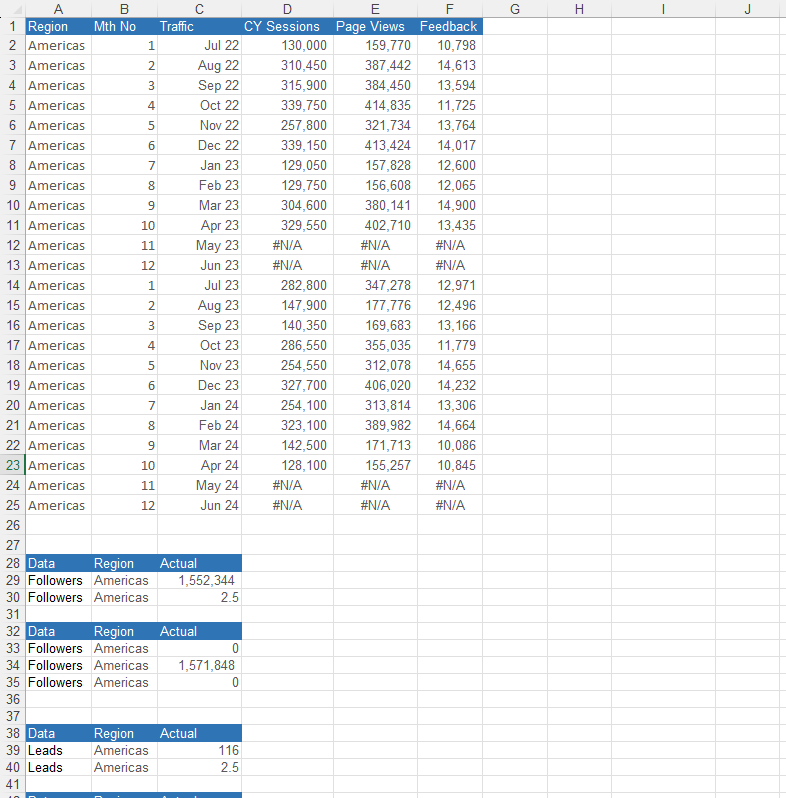
- Sales search by origin, direct traffic, referral, organic, social media.
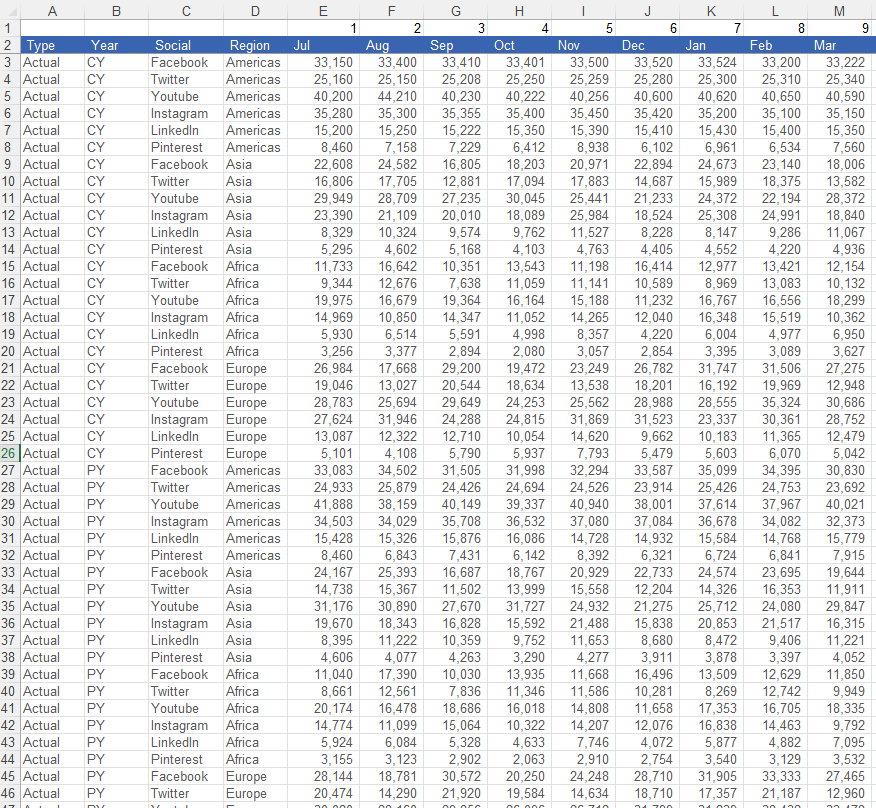
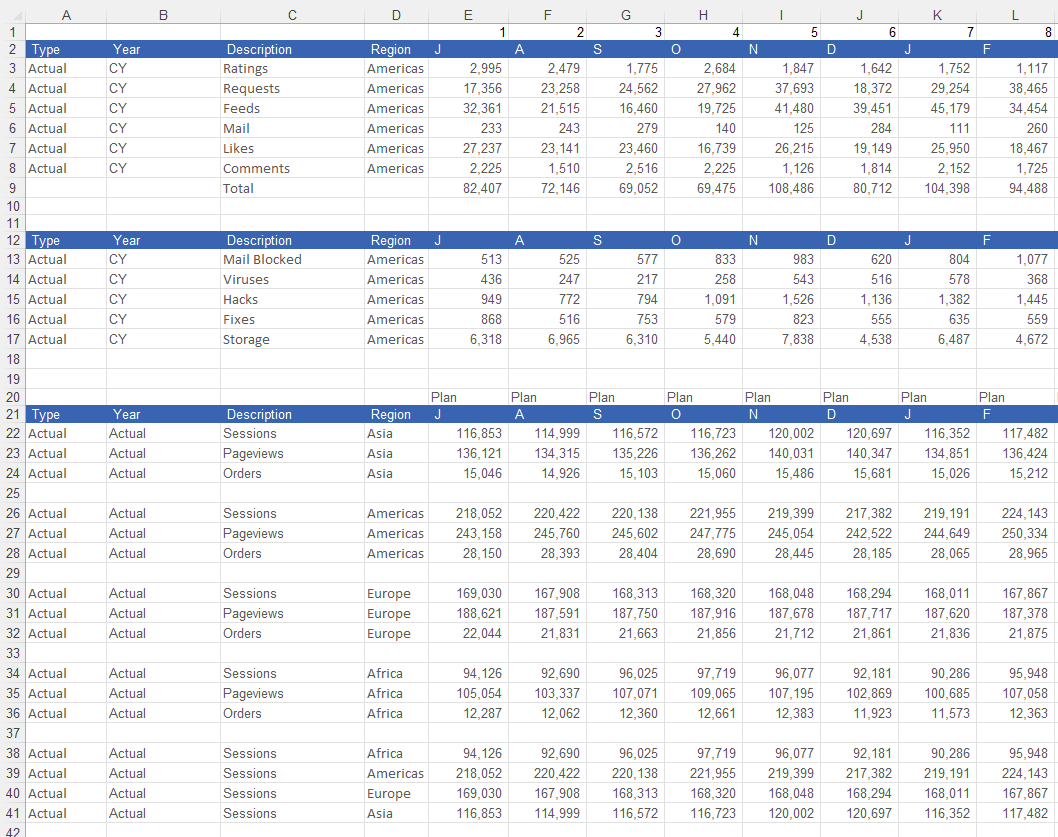
- Social metrics – including feeds, requests for information, comments, likes and mail.
- Other include: Sales by department, full time equivalents actual v plan, key HR metrics, staff performance, cost per hire by region and open positions, there are also a range of cool charting techniques which tell a compelling story.
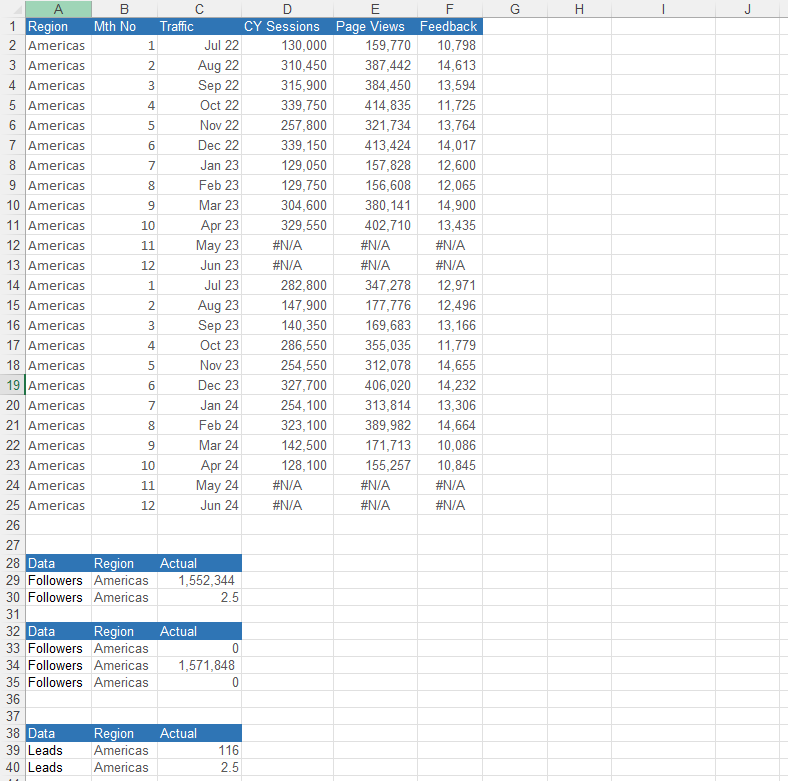
There is a logical progression for the inputting of data in order to best calculate the results of your team.
If you have any questions regarding this tool, don’t hesitate to reach out by email directly.
If you’ve found this tool useful, show your appreciation by leaving a rating and a review!
This business tool includes
1 Excel File (12 Tabs)


