Multi Purpose Excel Dashboard
Multi Purpose Excel Dashboard
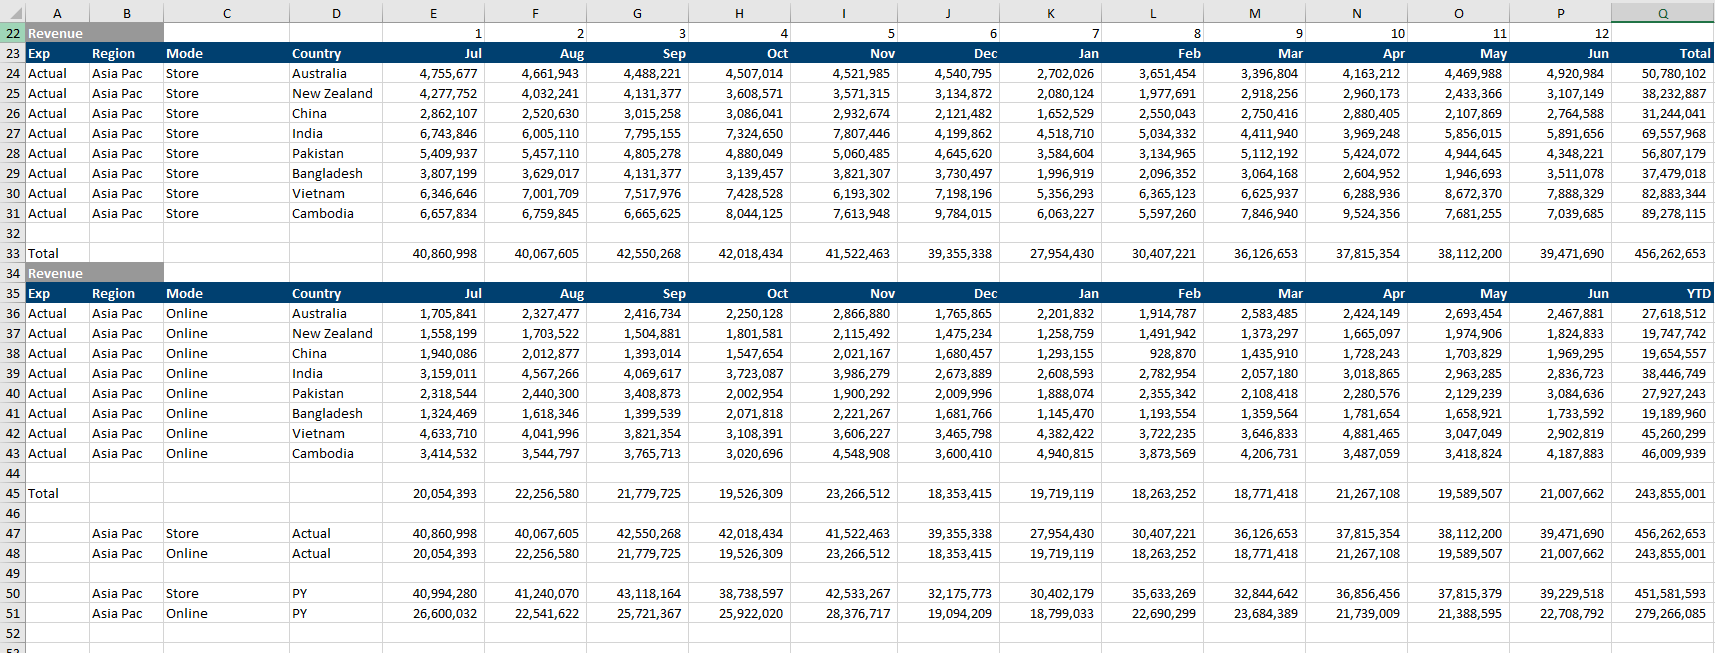
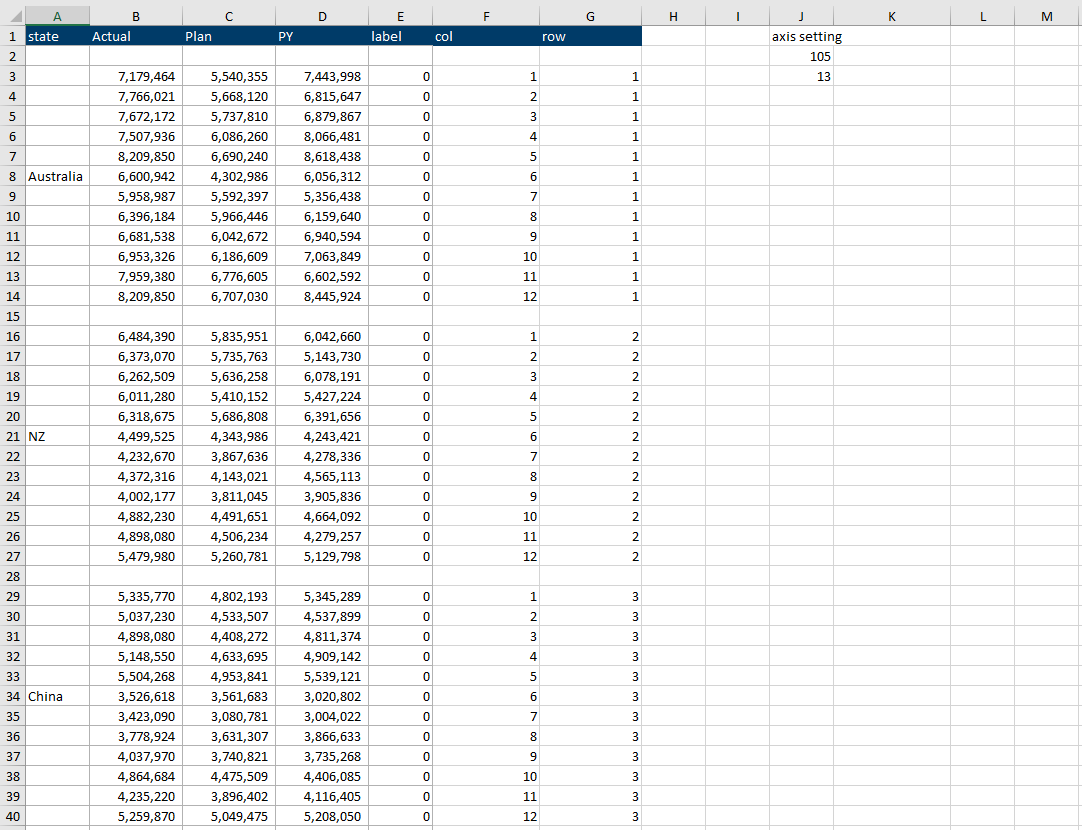
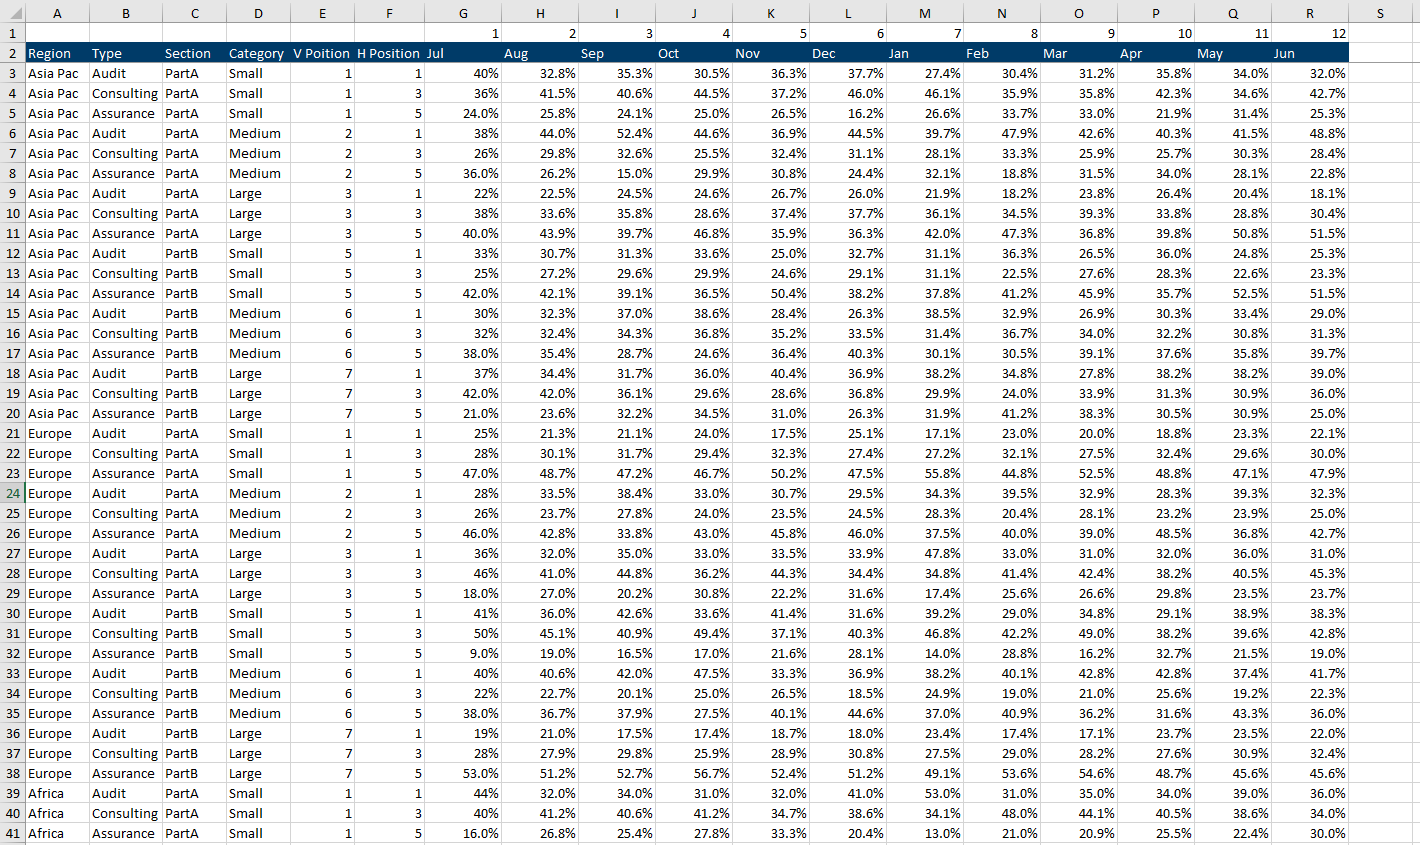
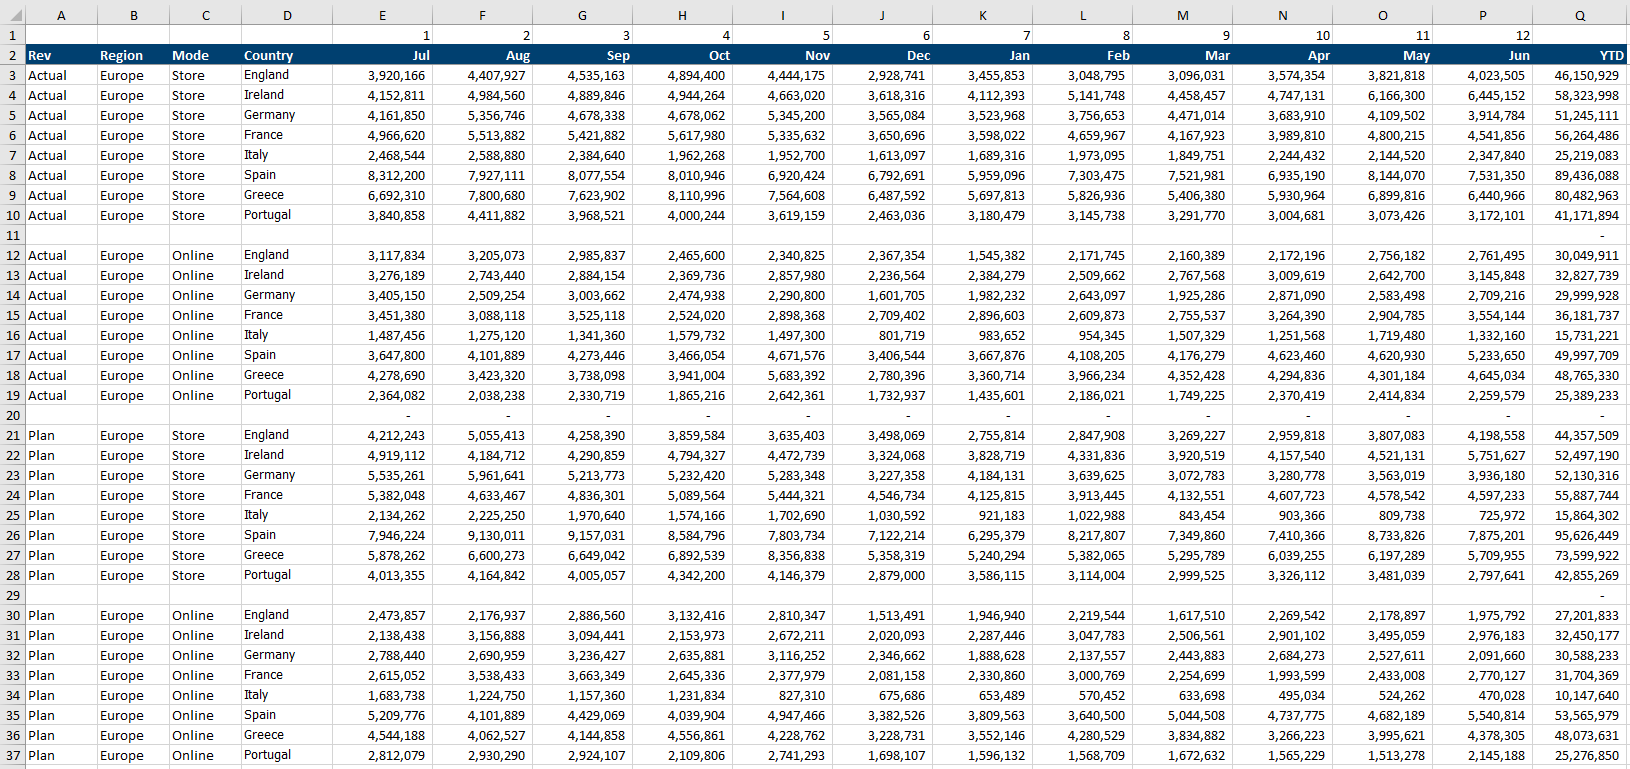
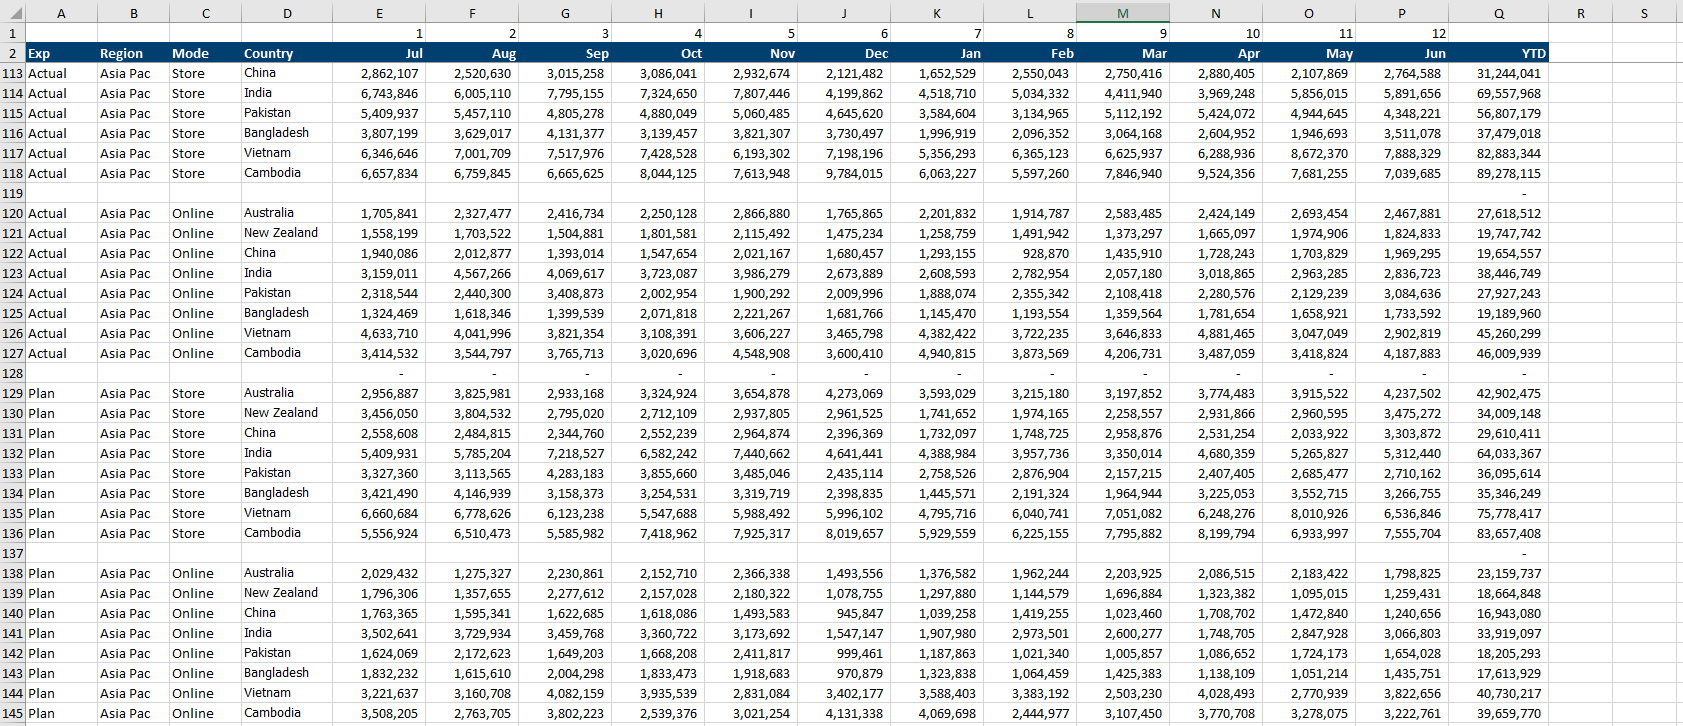
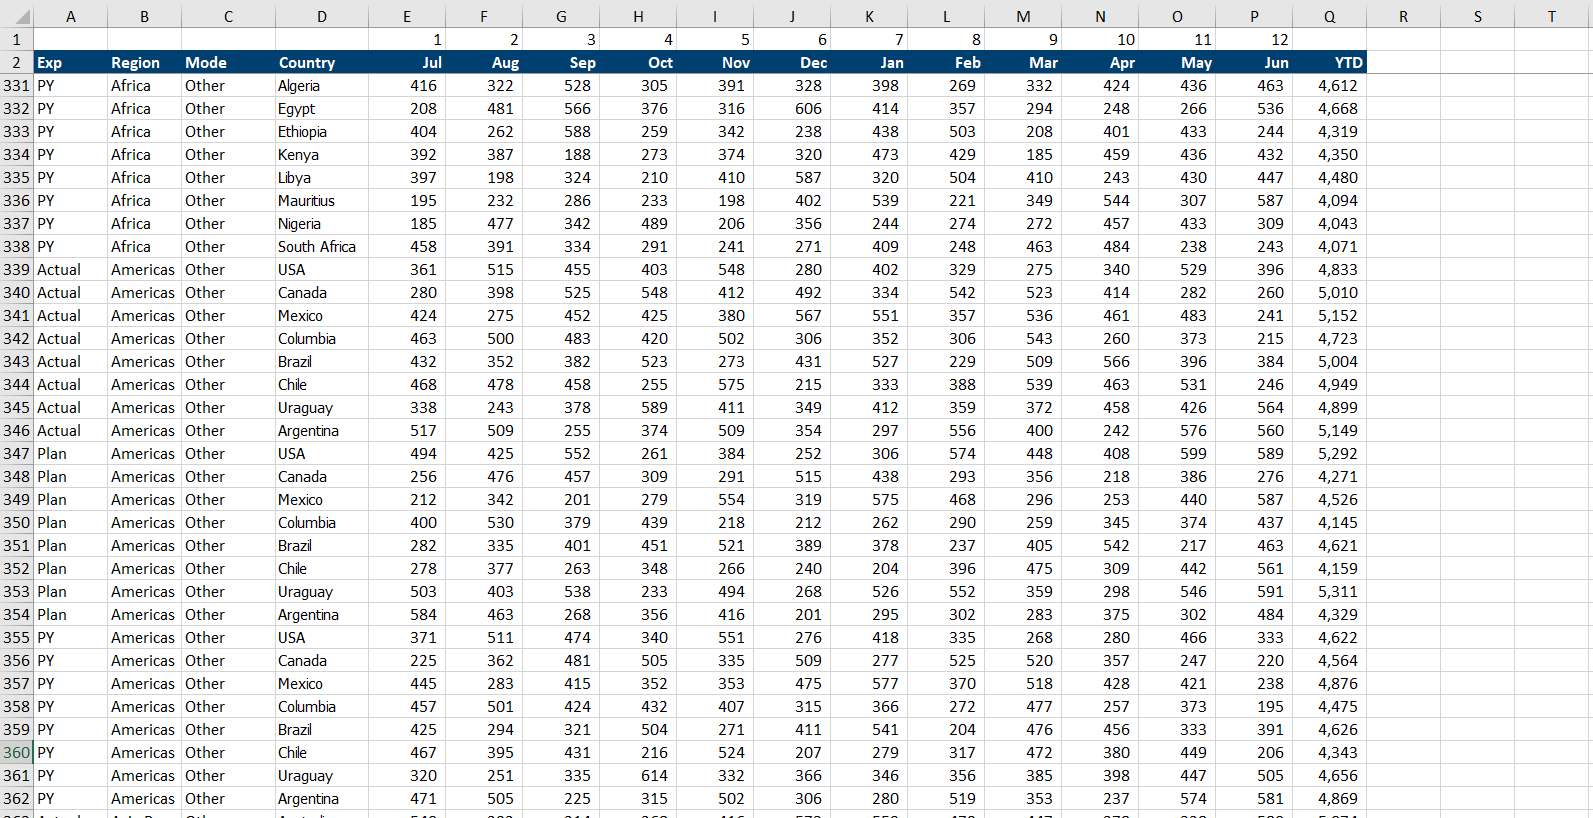
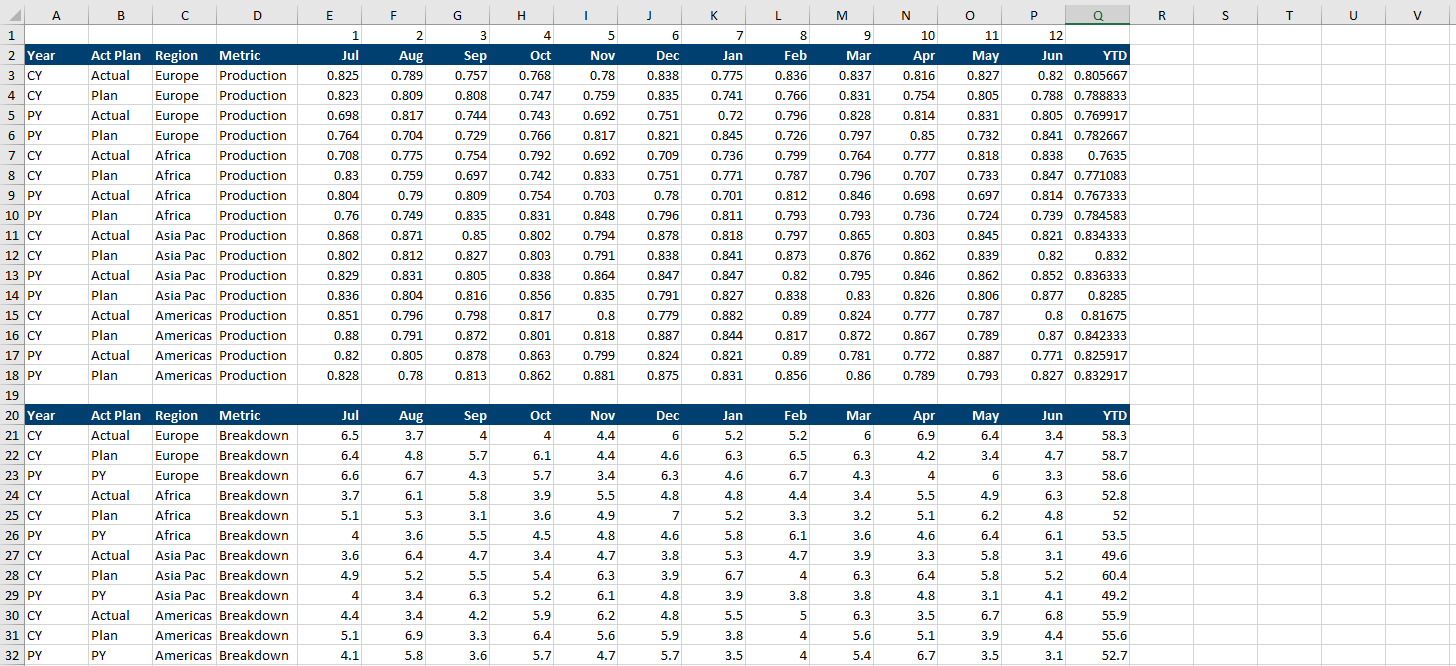
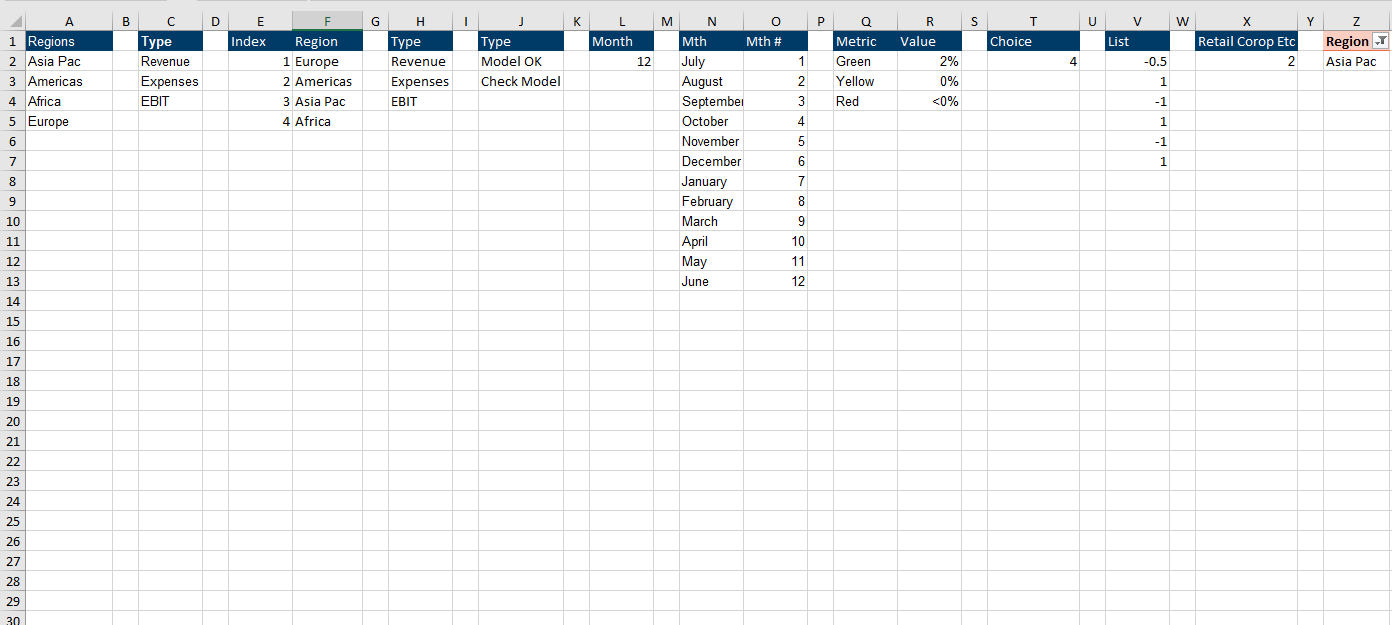
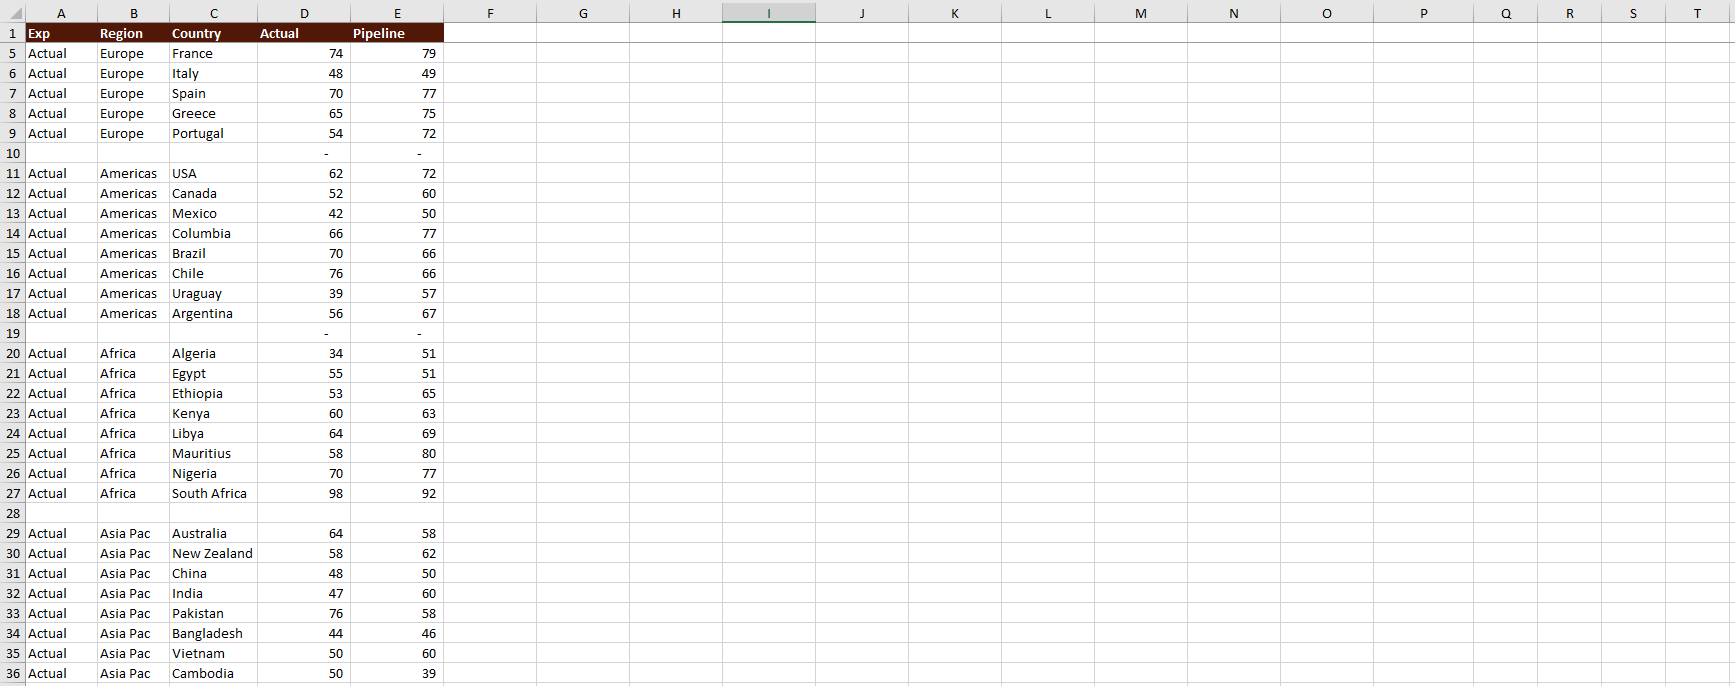
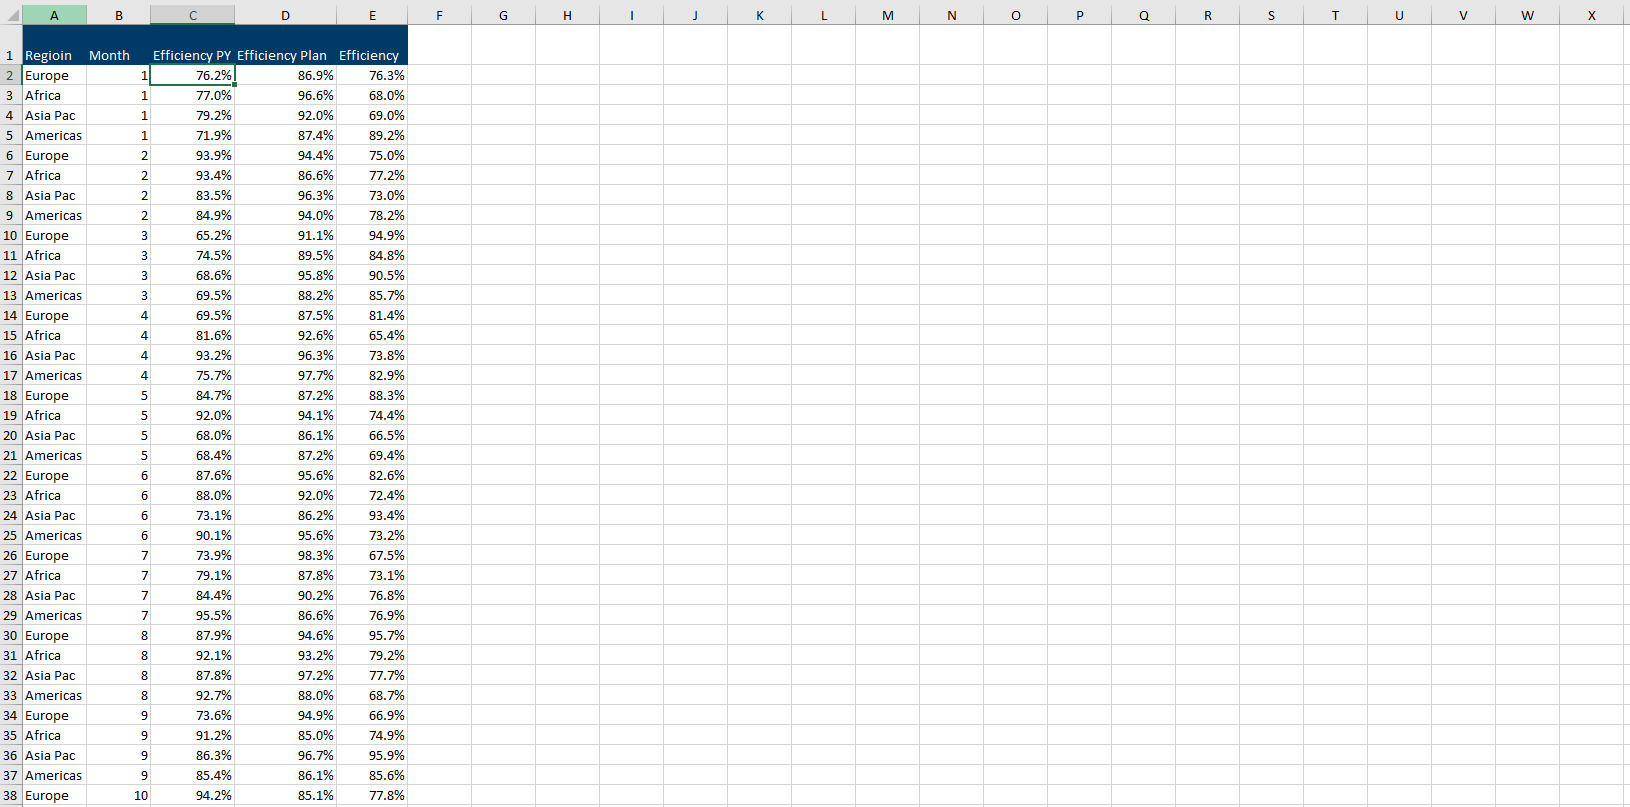
All the charts, fantastic financial modelling layout. Just enter your data into the input pages and the calculations will populate the charts.
Ready-to-use and instantly downloadable, this tool is excellently presented, whilst being clear and easy for the user to manipulate.
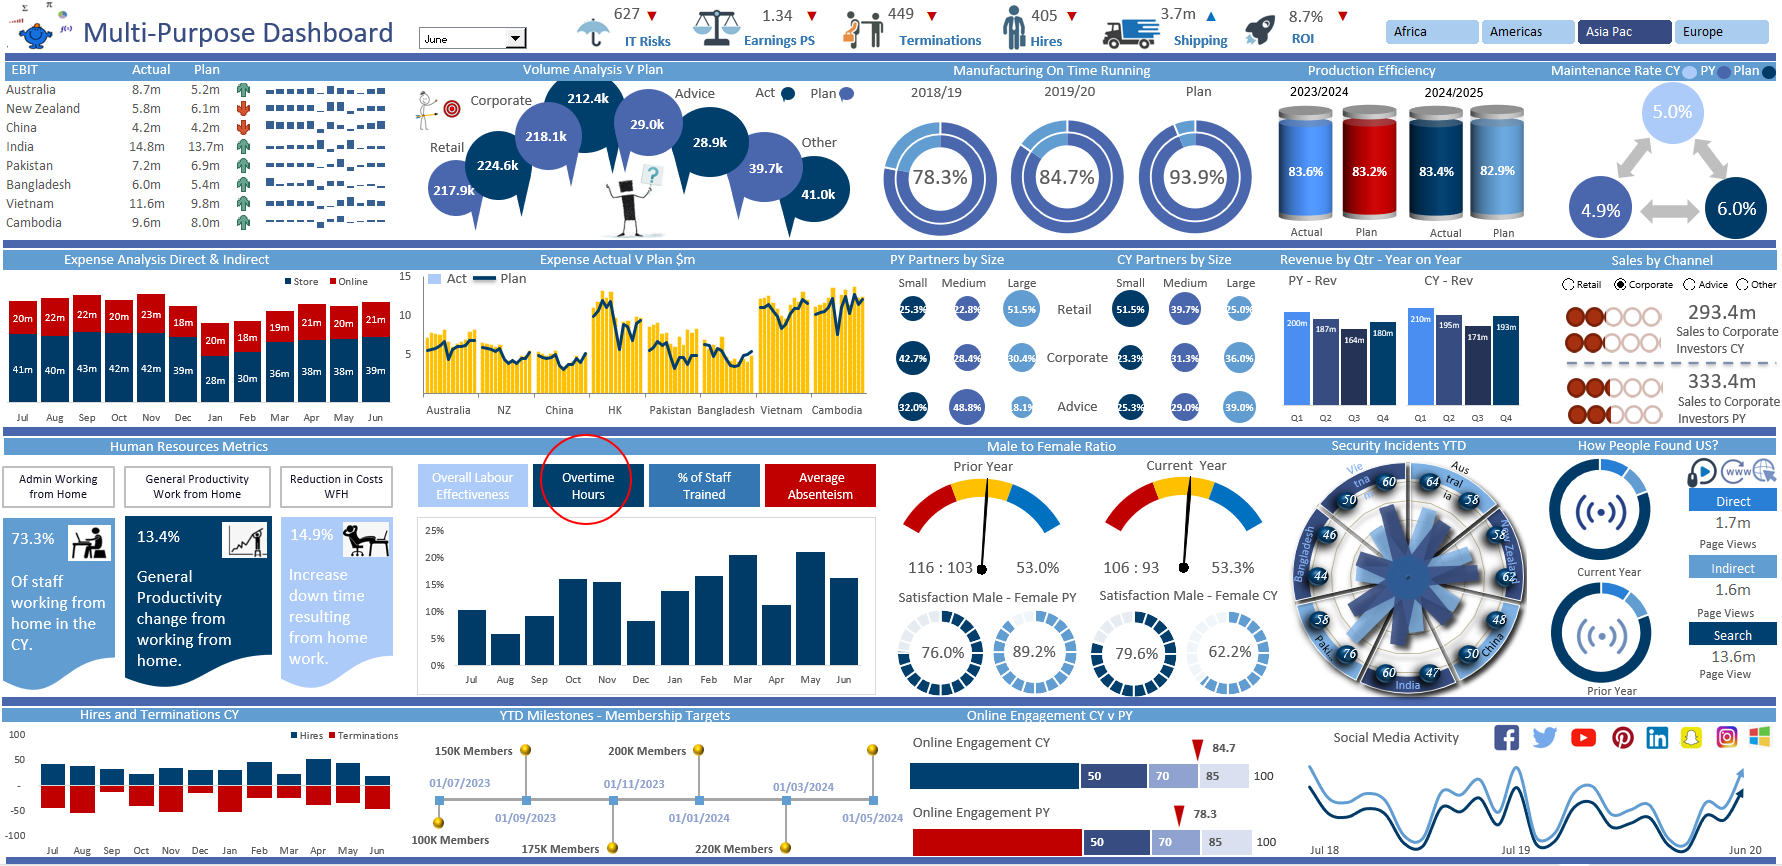
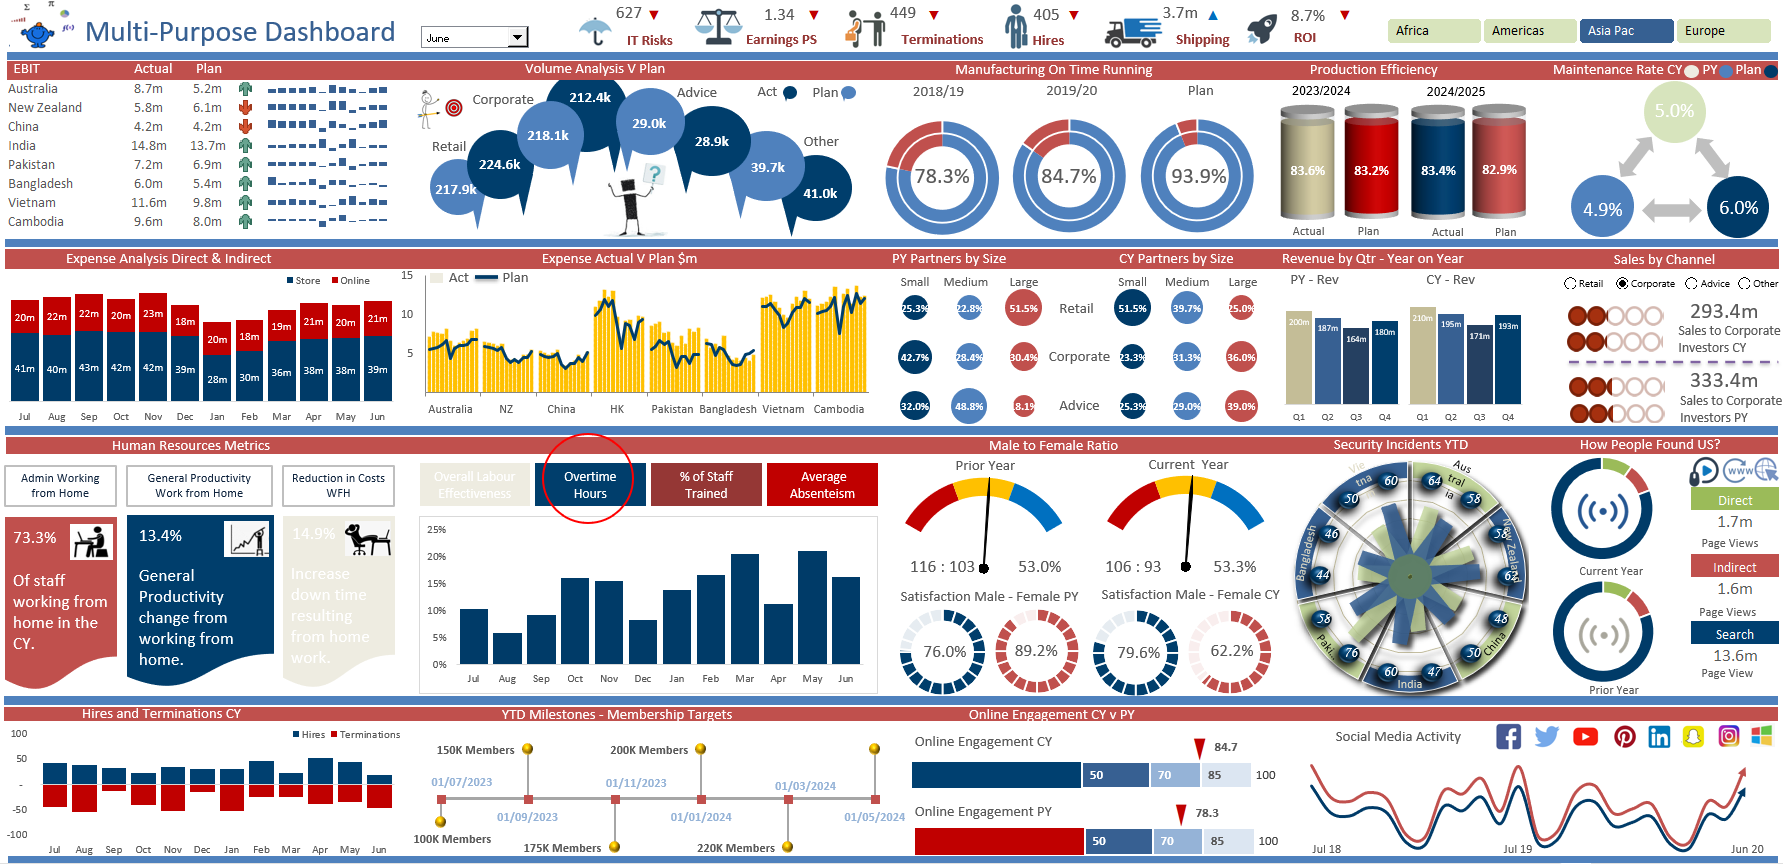
This multi purpose dashboard is an important resource for professionals to monitor and track the strengths and weaknesses of specific department areas, in order to increase performance. Within this tool are a number of key metrics, these include:
- Allocated cost by Department, Actual vs. Plan
- Satisfaction Metrics, including Customer Satisfaction Change Year on Year, and the Staff Satisfaction Change in Time.
- Hires and Terminations
- Online Engagement
- Cost of Goods Sold (COGS)
- Overtime metrics
- Absenteeism
- Other include: Membership targets, Staff Satisfaction, Earnings per share, ROI, IT Risks, Shipping, Staff Productivity, Volume analysis.
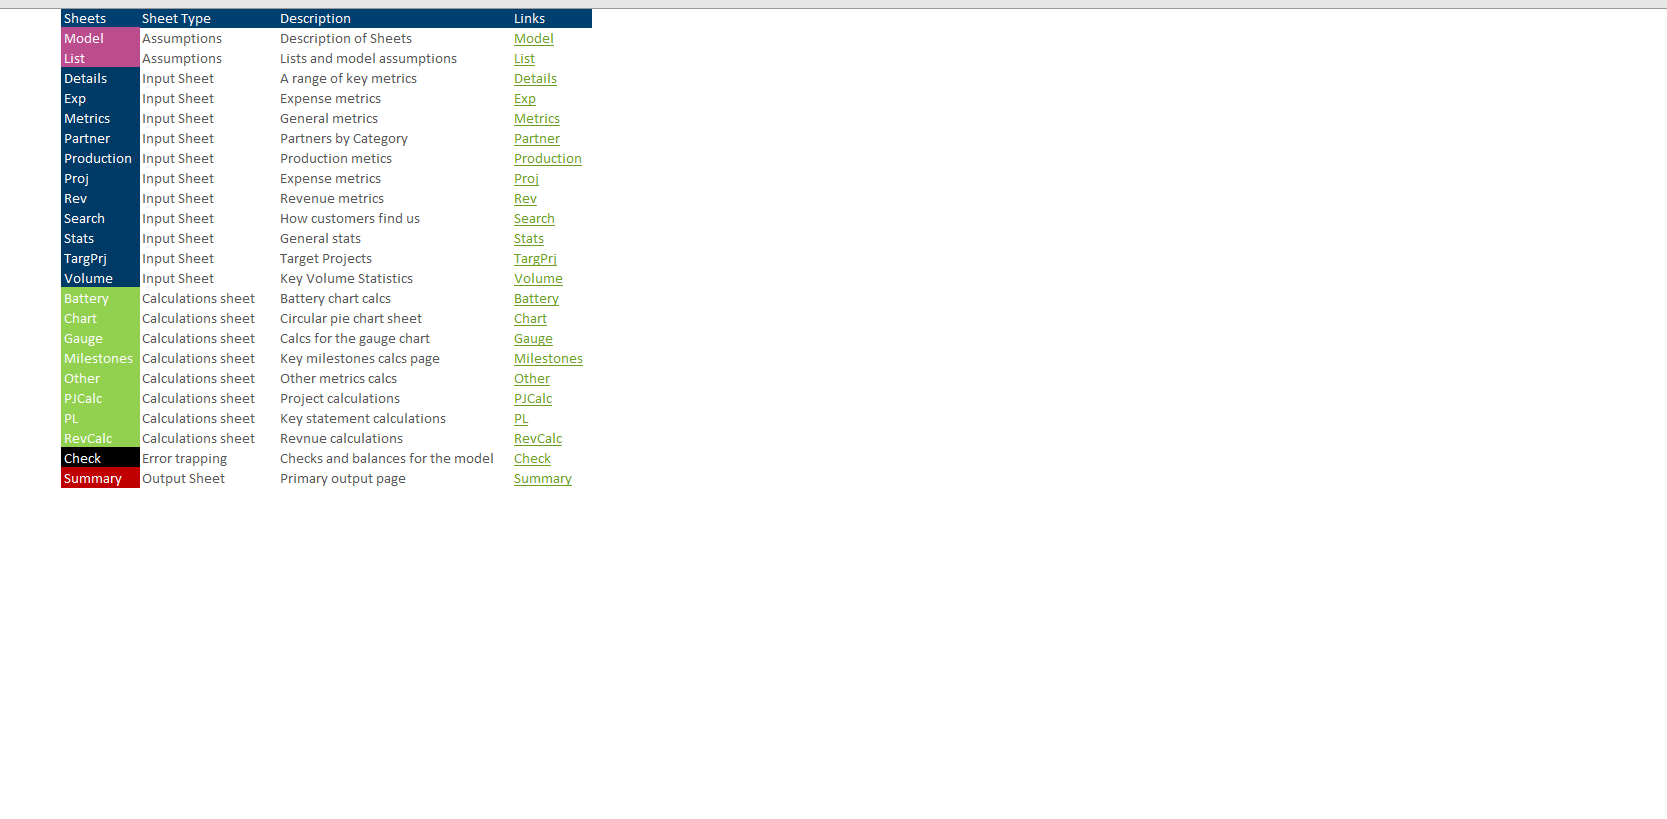
There is a logical progression for the inputting of data in order to best calculate the results of your team.


