Balanced Scorecard X
Balanced Scorecard X
Balanced Scorecard in Excel
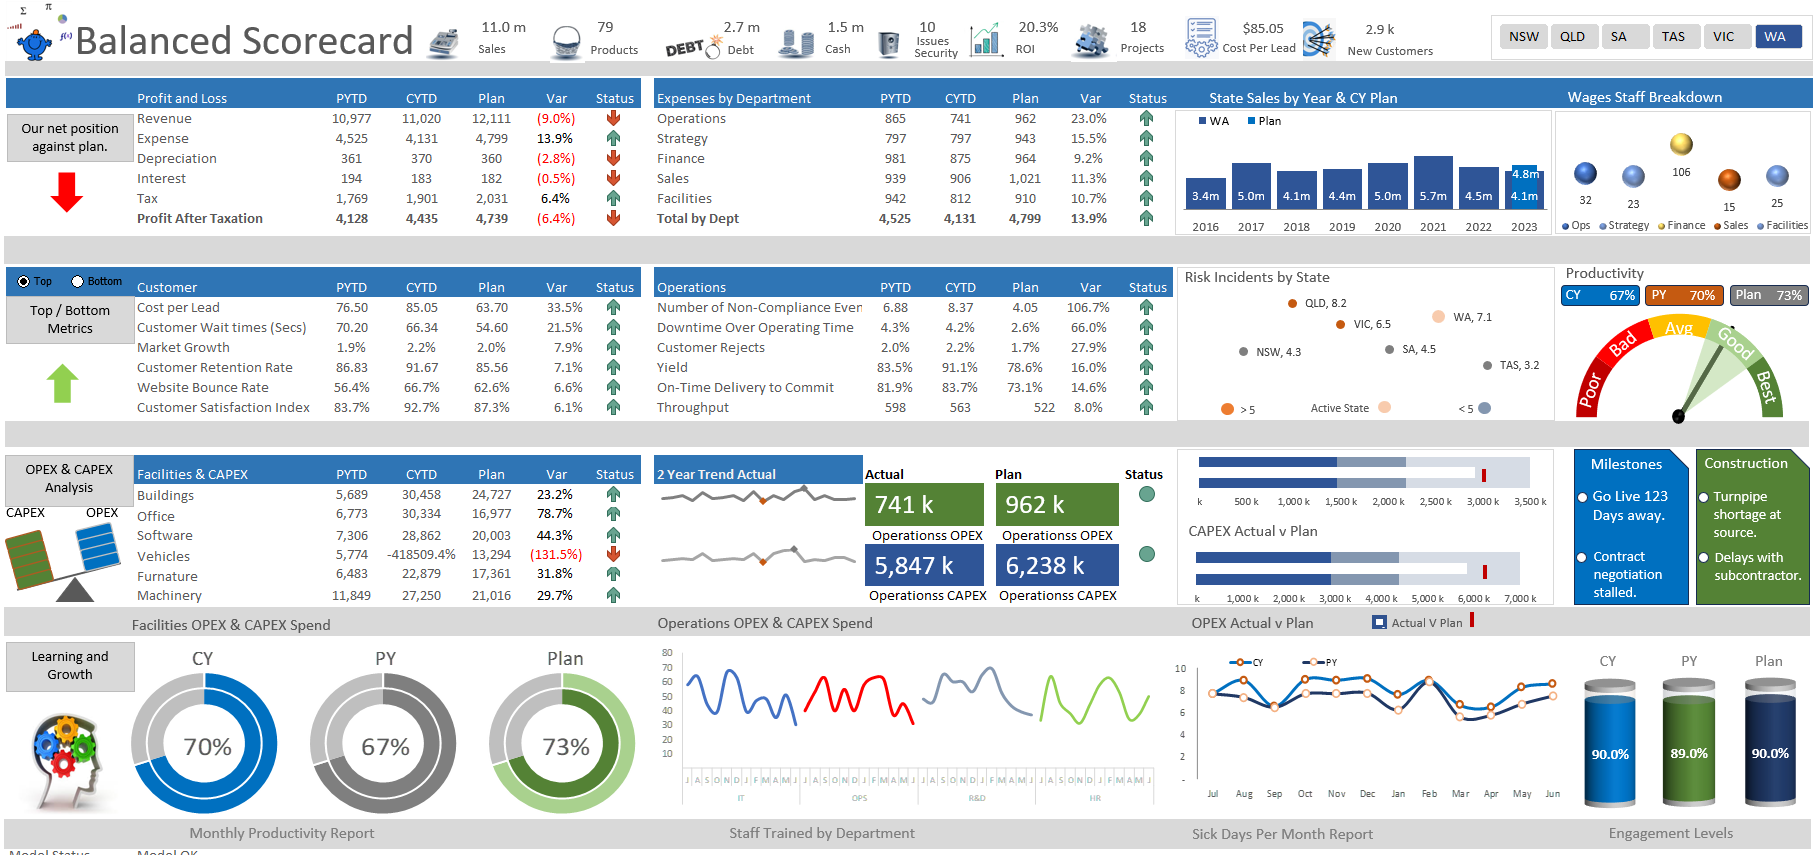
This is a highly detailed, yet succinct Balanced Scorecard dashboard which covers four distinct areas, finance, operations, customer and learning and growth.
Ready-to-use and instantly downloadable, this tool is excellently presented, whilst being clear and easy for the user to manipulate, simply add your own data.
This balanced scorecard dashboard is an important resource for professionals to monitor and track the strengths and weaknesses of specific department areas, in order to increase performance. Within this tool are a number of key metrics, these include:
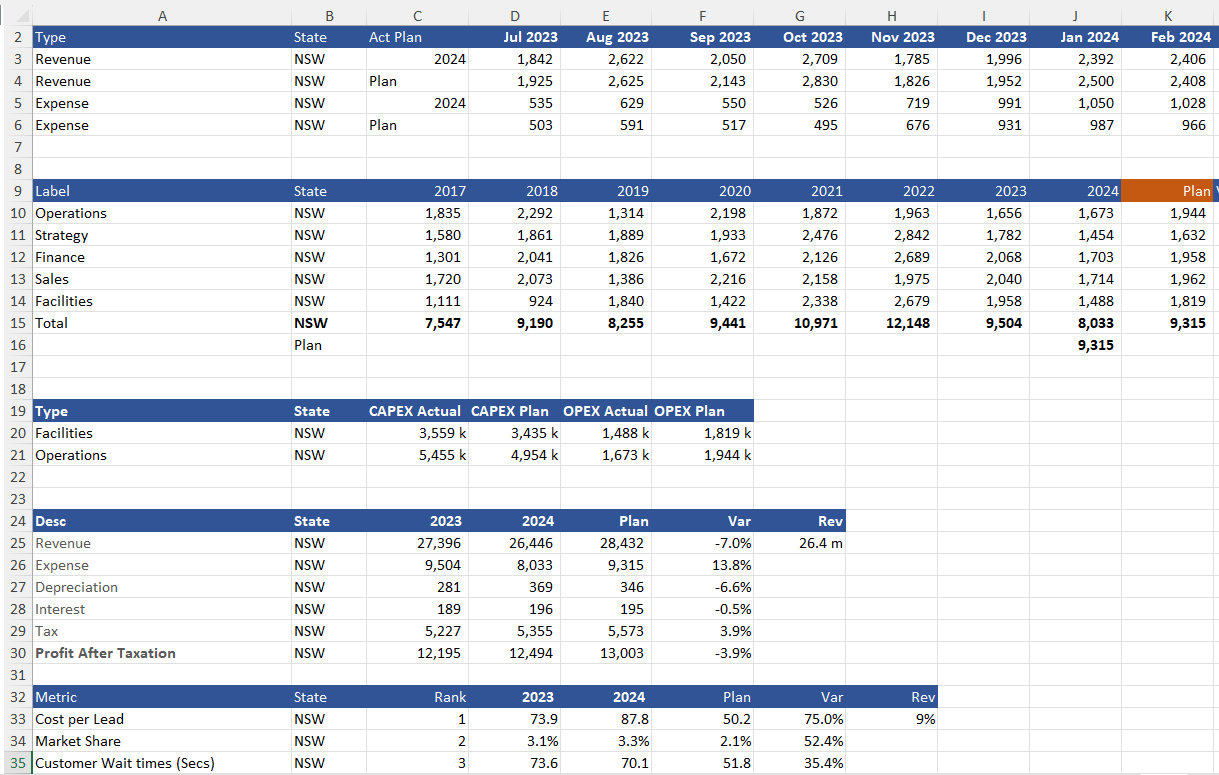
- Allocated cost by Region, Actual vs. Plan
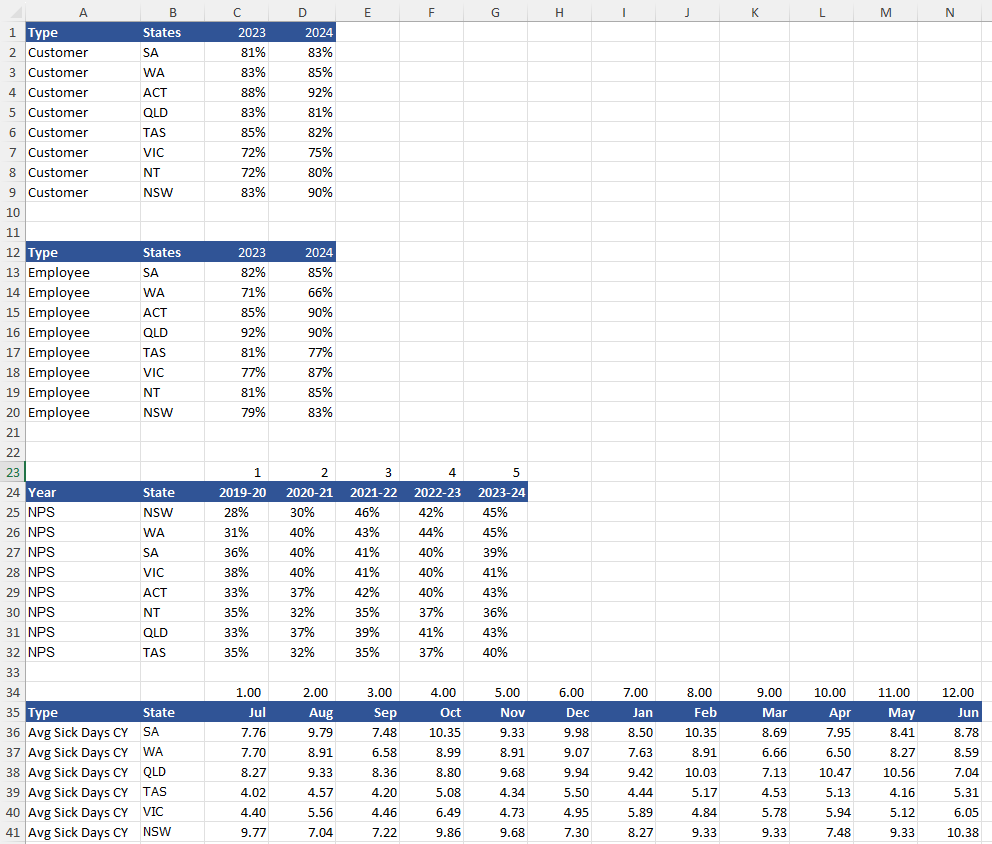
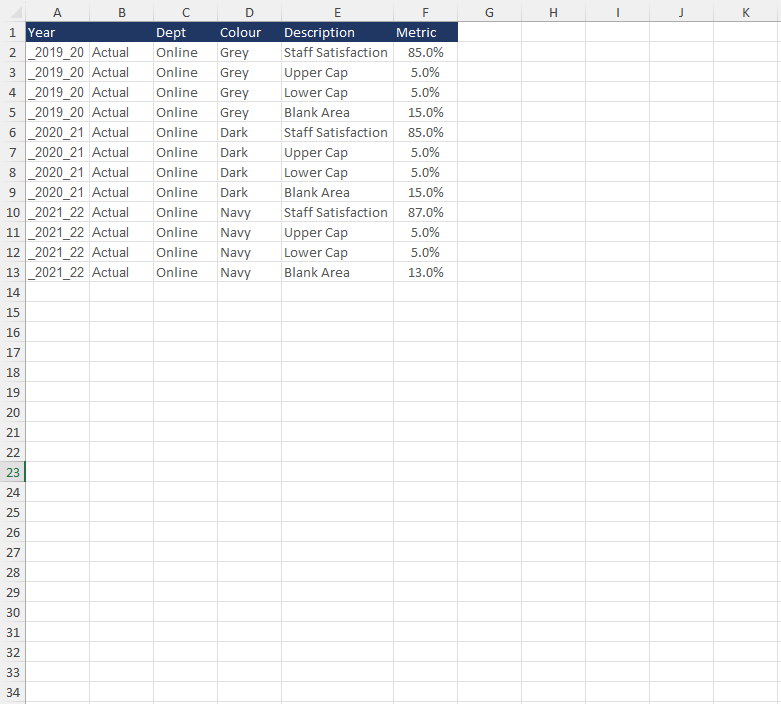
- Satisfaction Metrics, including Customer Satisfaction Change Year on Year, and the Staff Satisfaction Change in Time.
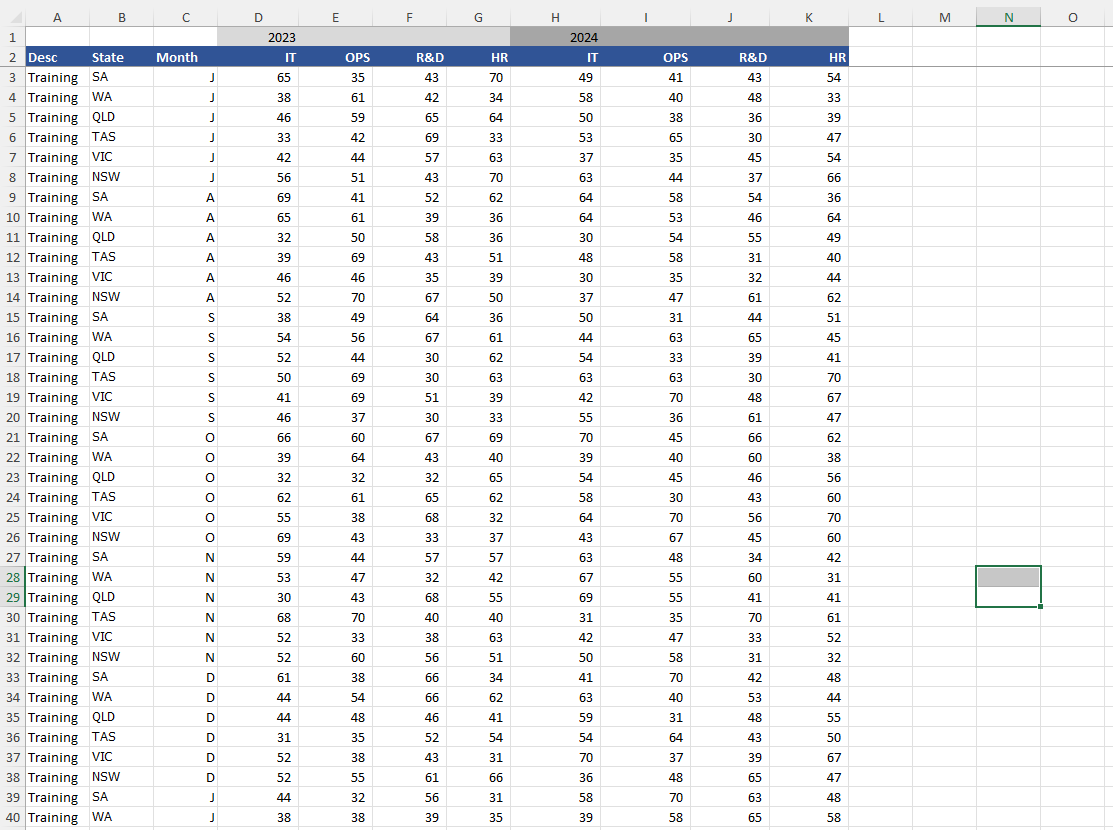
- Key learning metrics, current year, prior year and plan
- Number of projects, cash on hand, debt levels number of products,
- Net Promoter Score over time.
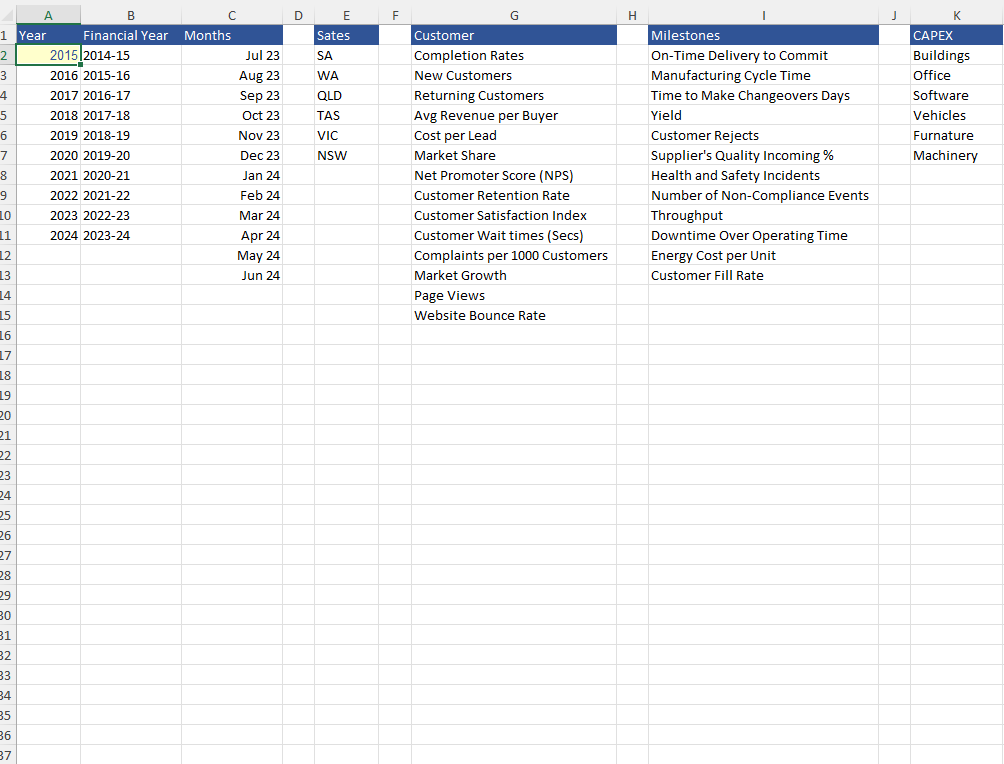
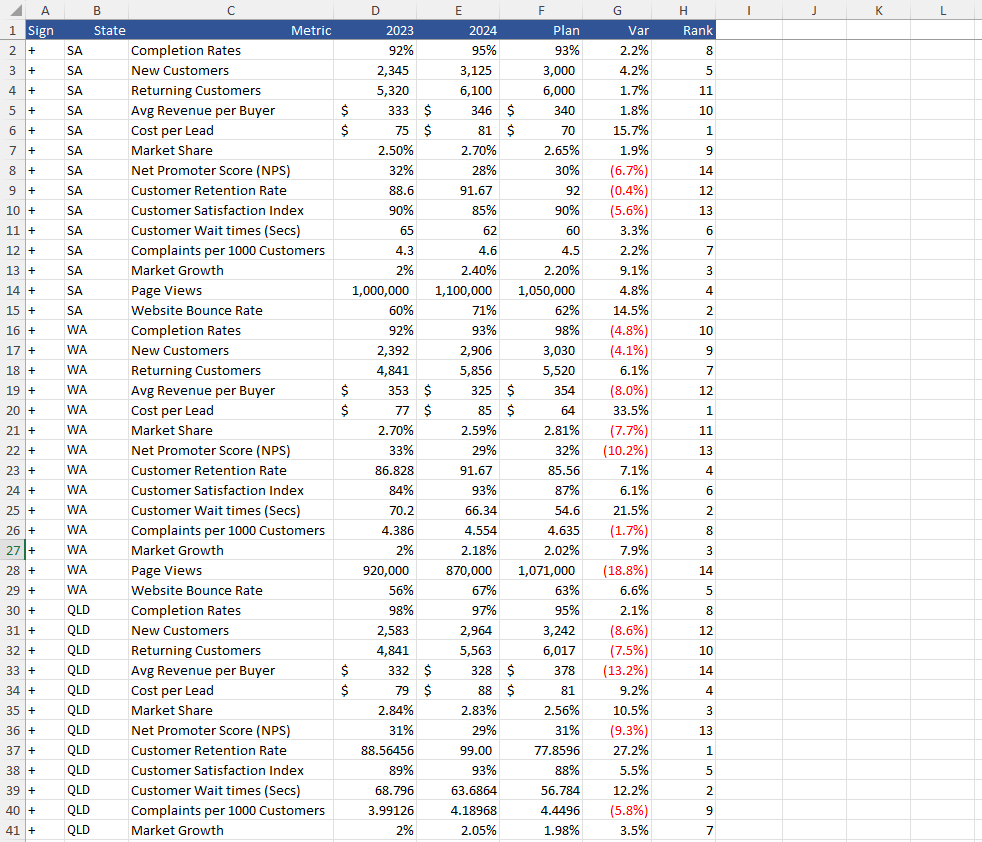
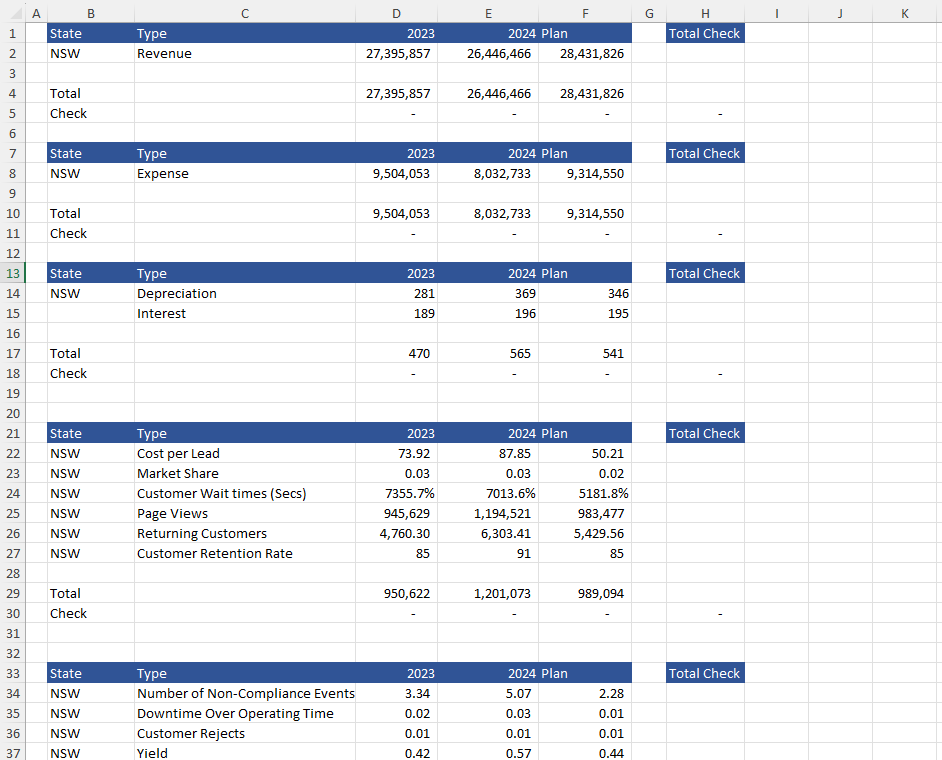
- A whole range (25) of operational and customer Metrics.
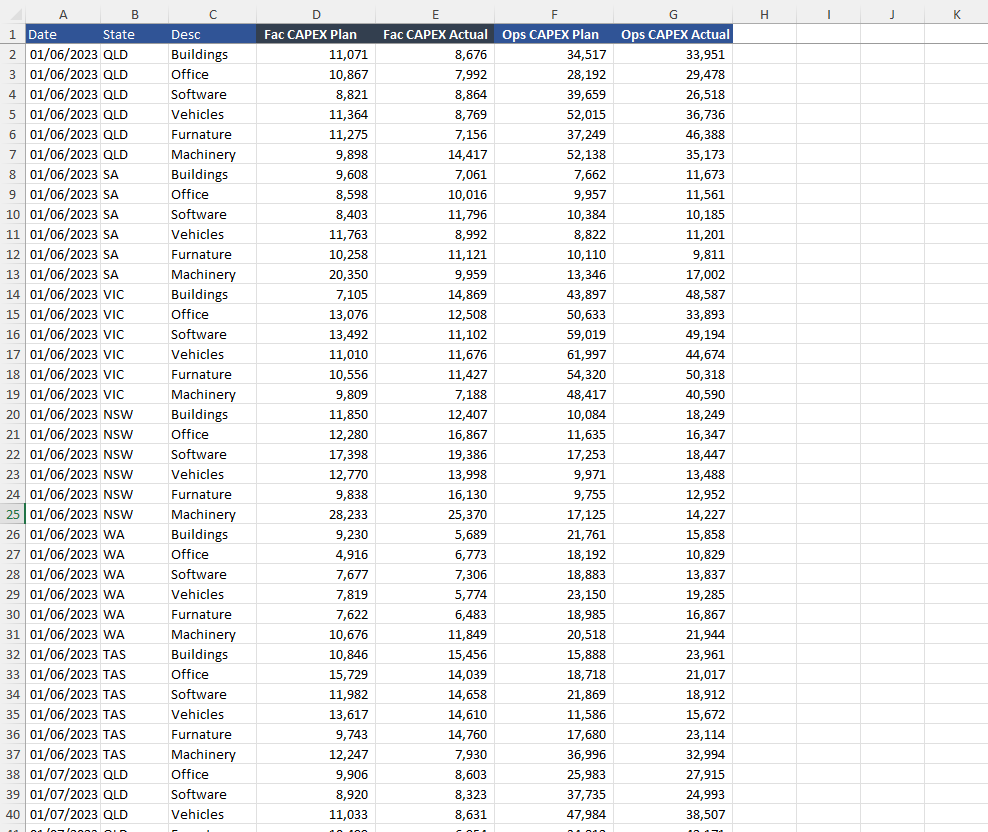
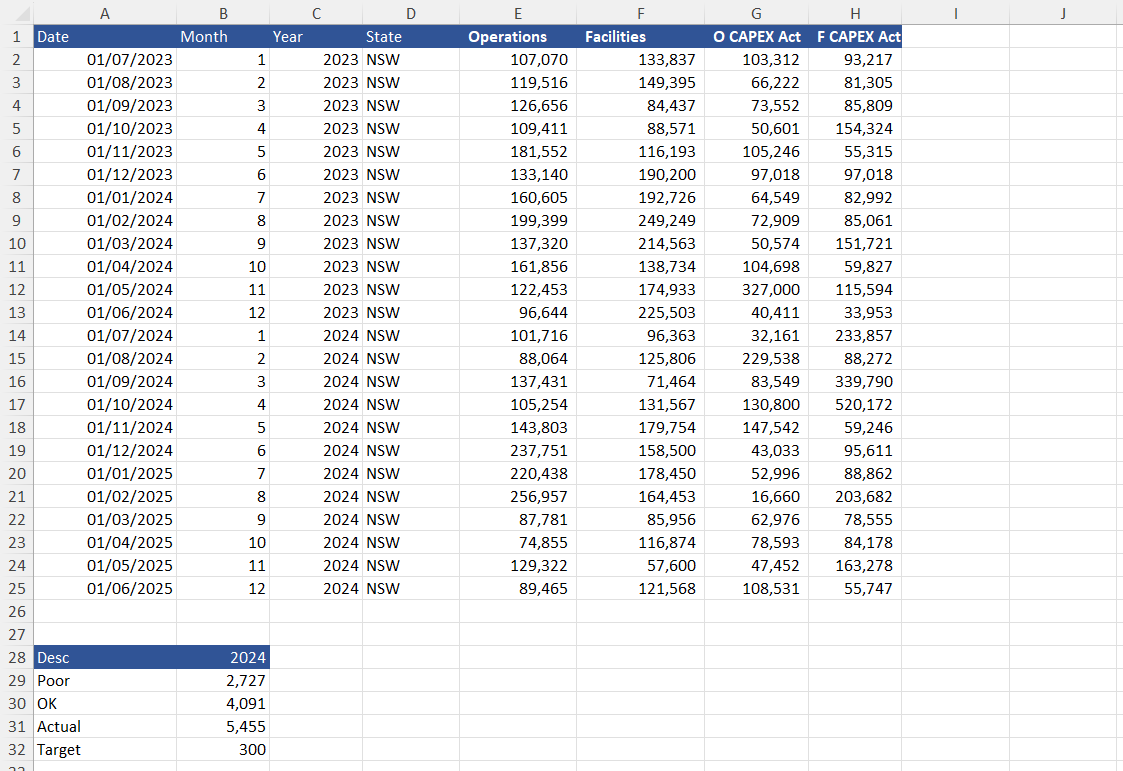
- Others include: Operations and facilities spend on CAPEX, actual v plan, average customer waiting time and many more.
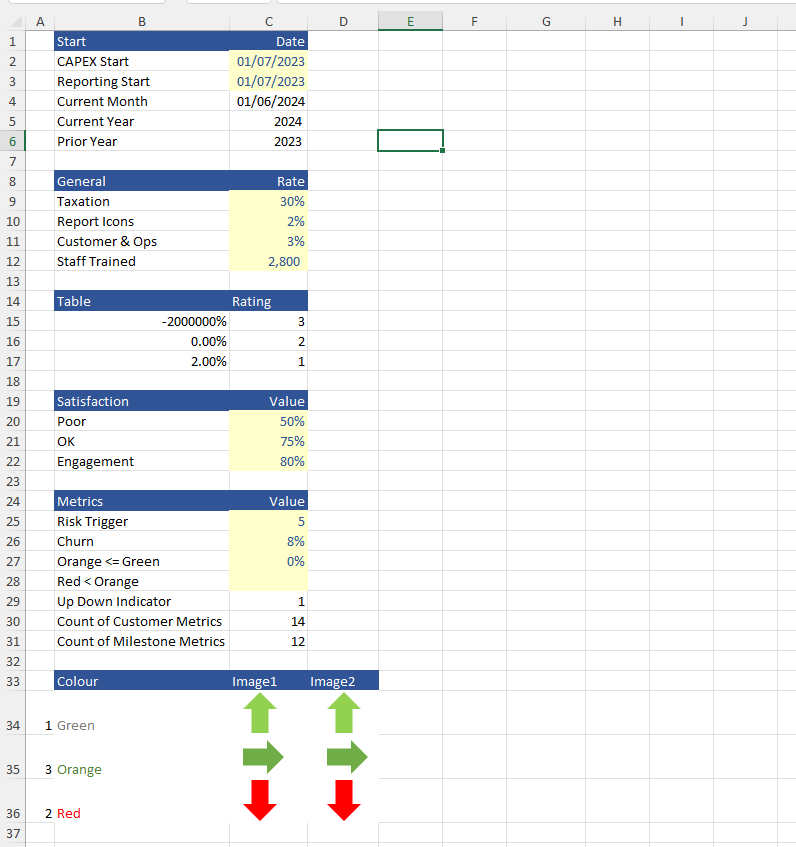
There is a logical progression for the inputting of data in order to best calculate the results of your team.
If you’ve found this tool useful, show your appreciation by leaving a rating and a review!
This business tool includes
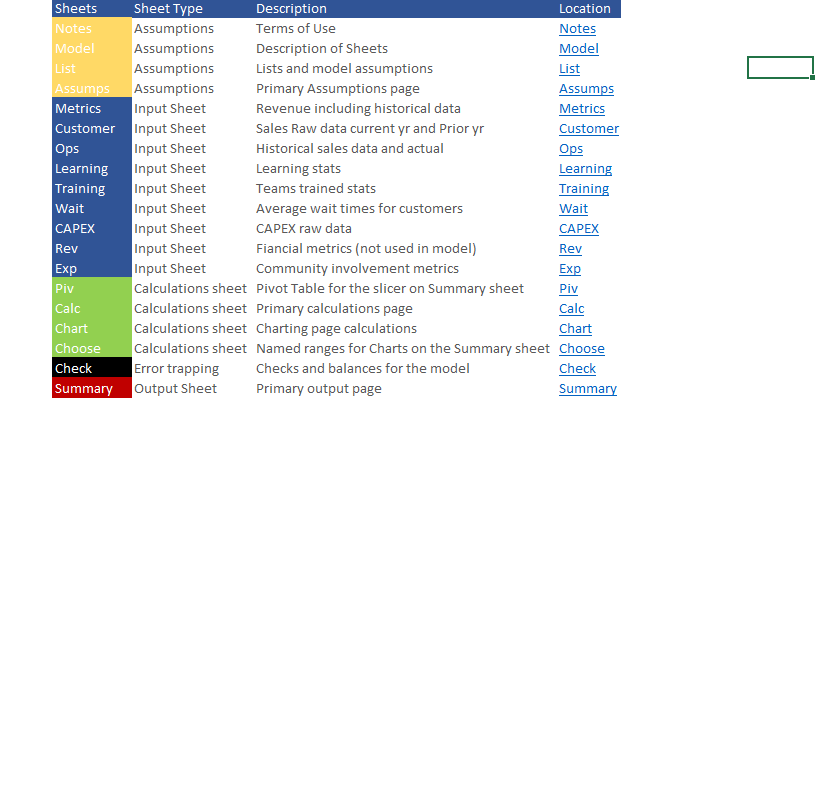
1 Excel File (15 Tabs)


