
Using VBA to Avoid Creating Multiple Scenarios
When developing a planning or budgeting scenario in Excel, your organisation might want to compare multiple scenarios against one another for multiple departments simultaneously. Ordinarily this would mean many sheets and a largish model to hold all of this information. When faced with an already large model due to many inputs this might be the straw that broke the camel’s back so to speak.
To get around this you could set up one sheet to hold all of the departments information at a summary level and draw graphical comparisons off the back of each department and against each scenario. For example, you may have a Plan high case, mid case and low case you want to compare against each department in the organisation. If there were 8 departments this would logically mean you would need 8 sheets by 4 scenarios, so 32 addition sheets to summarise a possibly already large model. Think that sort of thing doesn't happen, have seen this sort of thing time and again and it does add considerable size to a model. I am proposing you use one sheet to draw all of your graphical comparisons from and one sheet to summarise your P&L from. By changing the department and the scenario you should be able to change all of the data in the output pages.
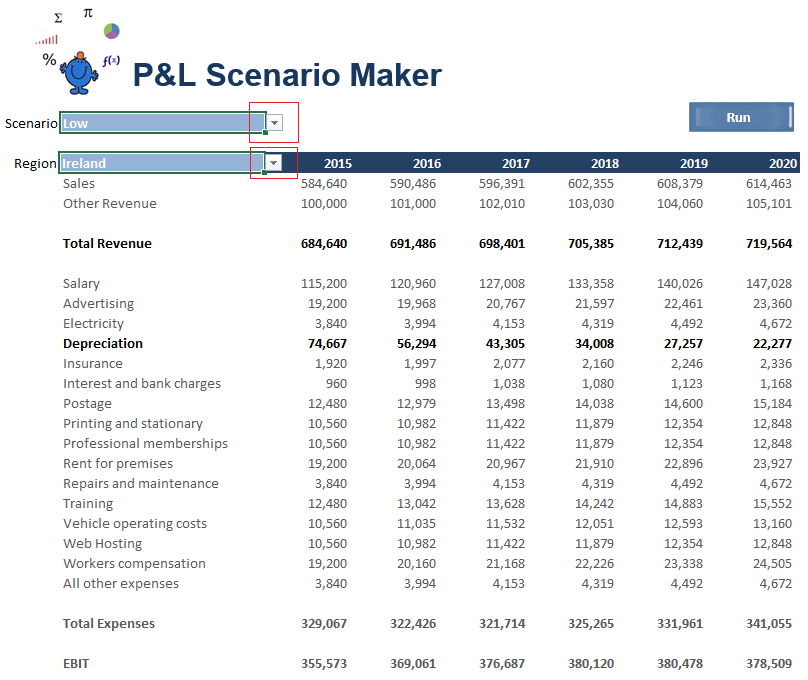
The above diagram shows that there are Scenarios and a Region drop downs. These change the P&L below. As these change the following procedure will capture key measures of your choice. This model has 1 year Actual (Blue) and 5 years Plan (purple).
As always setting up your model in the most effective manner will significantly reduce the file size and make the data easier to manipulate. The following is the procedure which will toggle scenarios and produce summary information for multiple scenarios.
'Has the flexibility to build in multiple additional P&L line items and scenarios. Created with an eye on the file size.
Option Explicit
Option Base 1
Sub StorageTool()
Dim ii As Integer
Dim j As Integer
Dim n As Integer
Dim k As Integer
Dim ar As Variant
Dim arr As Variant
Dim var As Variant
Const Regions=4
Const Scenario=4
Const Years=6
ar=[{"Total Revenue", "Depreciation", "Total Expenses", "EBIT"}]
ReDim arr(1 To UBound(ar))
ReDim var(1 To UBound(ar) * Regions * Scenario, 1 To Years) As Variant ' key measures by 5 Yrs
n=1
For k=1 To Regions 'Total Number of Regions/Departments
Sheet3.Range("D" & Rows.Count).End(xlUp)(2).Resize(UBound(var), Years).Value=var
End Sub
When attempting to adapt the above it will be helpful if you look at the attached file. It will show you how the data is arranged and why the procedure works on this dataset. It really does save a lot of space from a file when you need multiple scenarios and multiple Regions or Departments and don't want to add a lot of additional worksheets to capture those datasets.
The model doubles as a P&L with an assumptions page allowing you to flex CPI, Wage and Consumables growth etc.
